Investigating the 2016 Italy Earthquake
Investigating the 2016 Italy Earthquake
BBC Video (15 mins)
© British Broadcasting Corporation (BBC)
Pupil Activity
- As a class watch the video clip chosen by your teacher.
- While you watch note down important facts.
- In a small group decide on which five facts you think are most important in this news story.
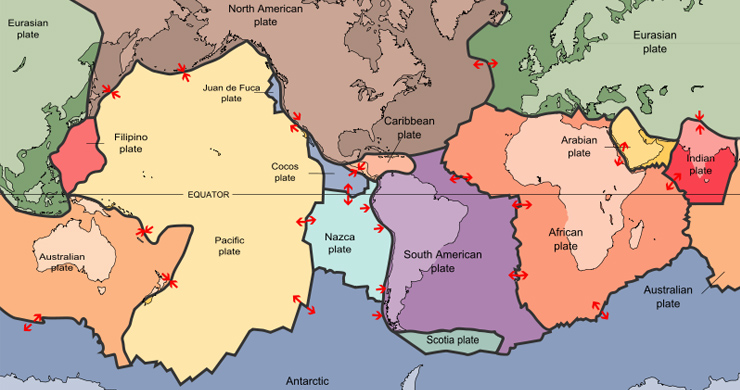
In this and the next edition of GITN we are going to investigate why certain hazards such as strong earthquakes and volcanoes are located in narrow belts. Italy lies along one of these belts.
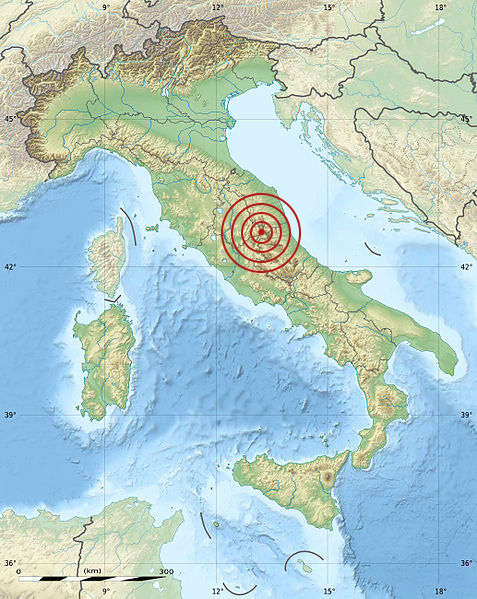
Image: Italy relief location map - Eric Gaba/Sting & NordNordWest © Wikimedia Commons under Creative Commons Attribution-Share Alike 3.0 Unported
Download Map - Click below
In the early hours of the morning when nearly everyone would still be in bed on the 24th of August 2016 an earthquake hit Central Italy.
The region hit is within the Appenine Mountains which are a chain of mountains sometimes called the backbone of Italy.
Its epicentre was close to Accumoli, with its focus or hypocentre at a depth of an estimated 4km depth. This was a very shallow earthquake.
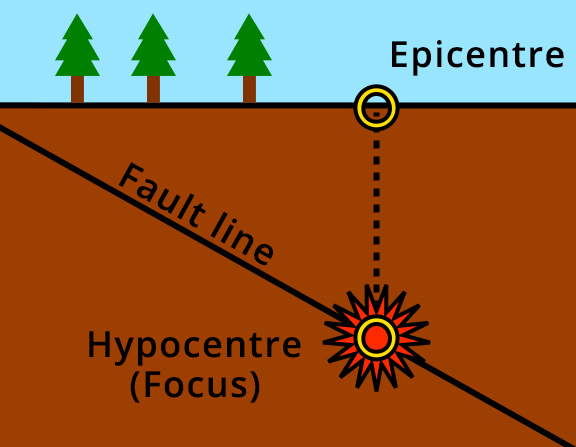
Image: Epicentre Diagram - Ansate / Sam Hocevar © Wikimedia Commons under Creative Commons Attribution-Share Alike 1.0 Generic
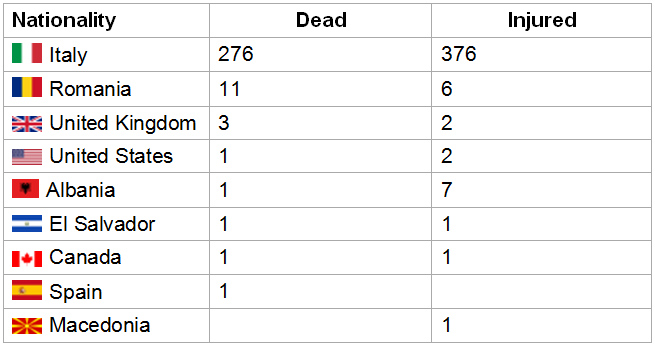
As of the start of September 2016, 295 people are known to have been killed but this figure is sure to rise further. 396 people were also seriously injured as a result of the earthquake.
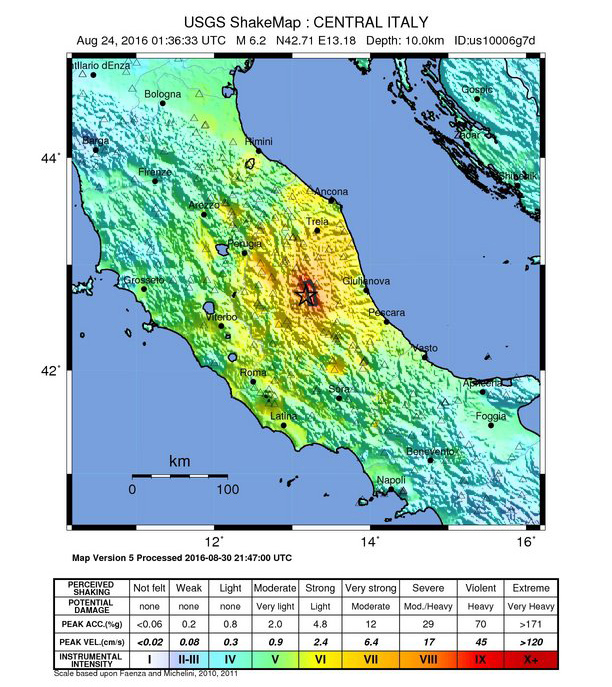
Image: Shakemap Earthquake 24 Aug 2016 Italy - United States Geological Survey © Public Domain
Download Map - Click below
- An earthquake happens when rocks within the earth move.
- Rocks move along a line of weakness called a fault.
- This movement releases energy that moves outwards like ripples in a pond when you throw in a stone.
- The place within the earth where the rocks move is called the focus or hypocentre/hypocenter (UK spelling/US spelling).
- The point on the surface above the focus/hypocentre is called the epicentre/ epicenter (UK spelling/US spelling).
- Once the waves of energy reach the epicentre; they spread out along the surface as surface waves; exactly like the ripples in a pond.
- Surface waves shake the ground and can cause major damage.
- The amount of the surface shaking depends on:
- The earthquake strength of the earthquake; caused by:
- How big an area of rock moves along the fault.
- How far the area of rock moves along the fault.
- How long in seconds it takes for the rock movement.
- How deep the earthquake is.
- The earthquake strength of the earthquake; caused by:
The Italy earthquake was measured at 6.2 on the modern moment magnitude scale that goes from 1-9.5(so far); so it was not a very strong earthquake. However it was very shallow (estimated at around 4km) so nearly all of the energy reached the surface and it was a long (over 20 seconds) movement so the shaking lasted a long time.
Moment Magnitude Scale of Earthquakes
Scientists have measured earthquakes using the moment magnitude scale since the 1970’s. Sadly however many news channels, newspapers and even some teachers make the mistake of calling these values as being on the Richter Scale. The Richter scale was developed in the 1930’s and is very different to the moment magnitude scale for earthquakes below magnitude 6.
Above magnitude 6 the moment magnitude scale and the Richter scale are quite similar.
The moment magnitude scale changes by each level releasing 32 times more energy than the previous level.
Level 4 is the same amount of energy released by a 1 kiloton nuclear explosion or 1 metric tonne (1000 kg) of the high explosive TNT.
Level 5 therefore is 32 times stronger than level 4 so is roughly equivalent to the energy released by 32 tonnes of TNT and level 6 is 32X32= 1024 tonnes of TNT.
The strongest earthquake recorded was a magnitude 9.5 in Chile in 1960.
The town of Amatrice in Italy; before and after the 2016 earthquake.
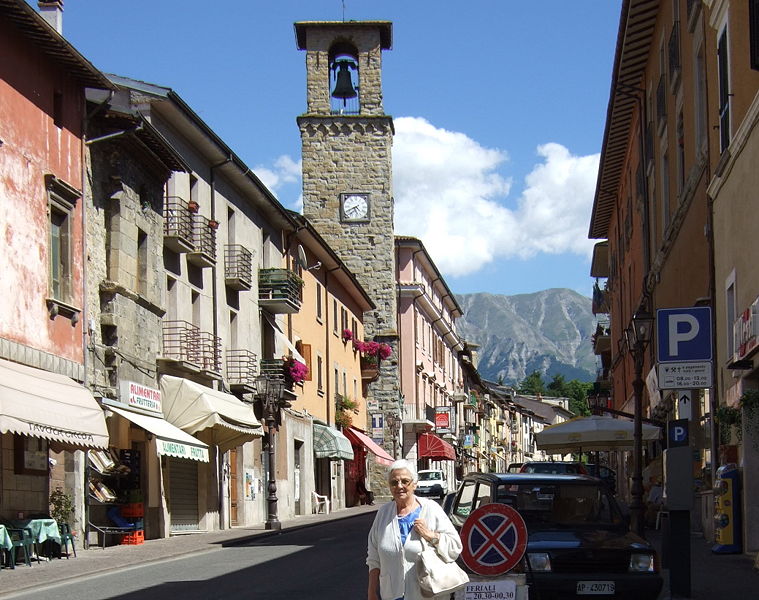
Image: Amatrice - Corso - Mario1952 © Wikimedia Commons under Creative Commons Attribution-Share Alike 3.0 Unported
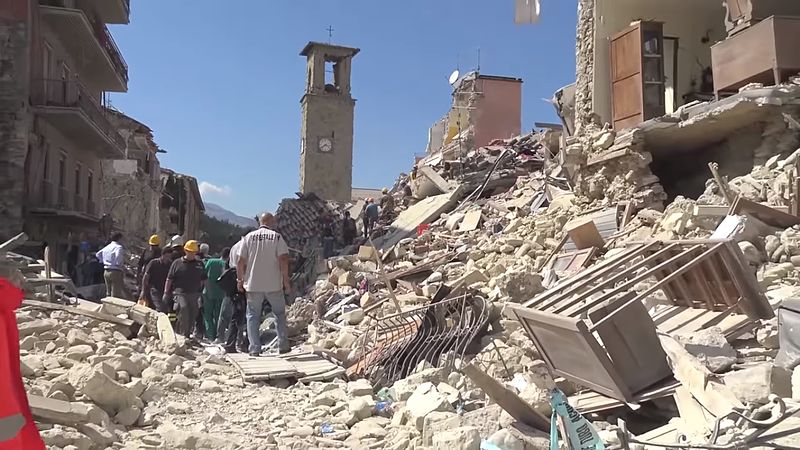
Image: 2016 Amatrice earthquake - Corso - Leggi il Firenzepost © Wikimedia Commons under Creative Commons Attribution-Share Alike 3.0 Unported
Nationalities of Victims
- The earthquake hit when most people were still in bed.
- This region is popular with tourists who like to stay in old villas (houses) in the Appenine Mountains.
- Buildings in the region were to have been built or converted to a standard to resist earthquakes in an Italian law passed in 1974. People died however because the work specified by the law had not been met. Even a school built in 2012 might not have met the standards. Italian courts are already investigating these issues.
The authorities in Italy passed the antiseismic law of 1974 which explains all the construction techniques of an earthquake resistant building.
![]()
Image: Quake epicenters 1963-98 - NASA, DTAM project team © Public Domain
Look at the map above which shows individual earthquakes as a small dot. The map only shows earthquakes between 1963 and 1998. It is impossible to see Italy under all of the dots!
Scientists looking at this map knew that Italy was going to have earthquakes; in the linked articles we are going to find out why.
Student Activity
5 Most
In the 5 most activity you:
- Scan the article and roughly note down what you think the 5 most important facts are to share as in a news report for the BBC.
- In a small group discuss and decide which of these facts would be the 5 most important things as a group to share in a news report for the BBC.
- Share these with the class to build up a class brainstorm.
DME
We are going to do something different over this and the next issue and carry out a DME into tectonic hazard over two editions.
Start your DME by carrying out the activities on the A3 activity sheet.
Image: Motion of Nubia Plate - Rollingfrenzy © Wikimedia Commons under Creative Commons Attribution-Share Alike 4.0 International
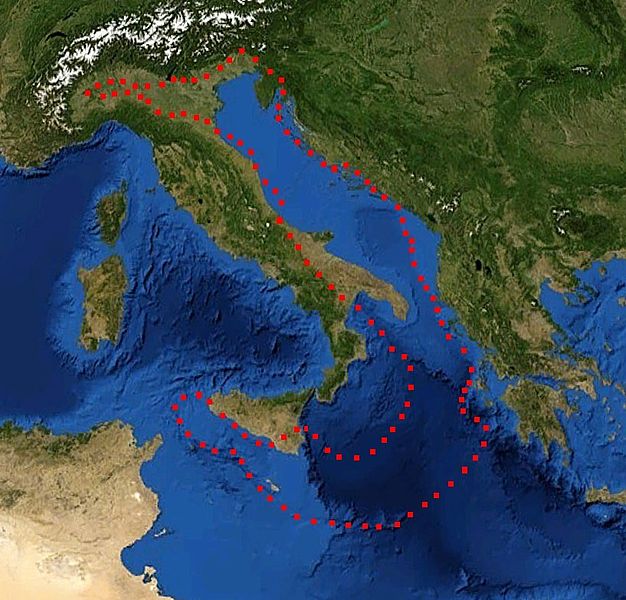
Image: Adriatic Plate - Eric Gaba (Sting) / NASA © Public Domain
Teacher Box
The resource is designed to be used as whole class resource from the front of the classroom on the projector/interactive whiteboard.
The various graphics should be supported by teacher exposition based on the text which will not be readable in permitted time to the vast majority of pupils), following this it is ideal that the students have access to the online resource in order to work on the activity sheet (designed to be printed on A3 size paper).
Ideally these activities will be supported by the use of a network room, tablets/laptops or students own phones/devices if permitted.
However the activities are also designed to be used in a typical one hour lesson with the teacher input using the resource from the front of the classroom alongside the resource sheet.
Students can then be set a homework task to study the three articles in advance of the following lesson.
The resource and accompanying sheet is designed to support the LNF framework while giving students key geographical knowledge about places in relation to tectonic hazards.
Pupil Box
Either in class or at home read and complete the activities in the online resource article and in the linked articles in this edition of Geography in the News. Attempt to complete all of the activities in the resource sheet.
What you will learn:
- You will increase your knowledge about the Italy Earthquake 2016
- You will increase your understanding of how these factors may affect human beings and human activities
- You will have you the opportunity to learn or practice important literacy and numeracy skills.
You will learn new geographical terms highlighted in purple these should be learned and added to a glossary. A glossary is a list of words and their meanings. You could have one in the back of your geography exercise book, if you have a planner it is probably a good place to keep a glossary, or you may keep a separate glossary or word book. A good glossary helps you build your vocabulary and your literacy. Research meanings using related article content, discussion or a dictionary (either online or a book).