Low Pressure in the News - Hurricane Season
Starter Activity
- Place
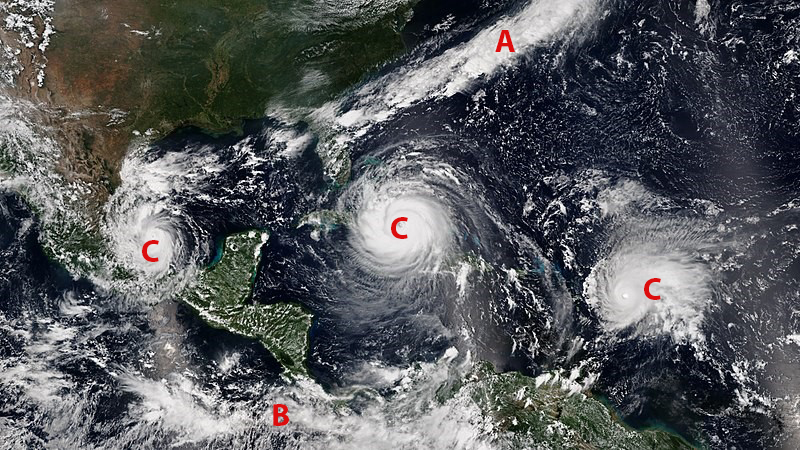
a. For land name as many places as you can on the satellite image.
b. For water name as many places as you can on the satellite image. - Describe the distribution of cloud at:
- What do you think cloud features C might be?
- Can you think why this satellite image might be rare?
Hurricane Season
At the end of last summer the team here at Geography In The News were just finishing our last edition on climate change in Wales and another rainy summer.
We started to look at the role of low air pressure and we wrote that this edition would be all about low air pressure in the news.
As Geographers we knew in advance that low air pressure was going to be big, big news this Autumn!
The big weather based news stories each year are based on the lowest air pressures recorded each year – Tropical Storms – and their regional names – Hurricanes, Cyclones and Typhoons.
- A hurricane is a tropical cyclone that occurs in the Atlantic Ocean and N.E. Pacific Ocean.
- A typhoon occurs in the N.W. Pacific Ocean.
- A cyclone occurs in the south Pacific or Indian Ocean.
Ocean Basin Storm Seasons
|
Basin |
Season |
Season |
|
North Atlantic |
June 1 |
November 30 |
|
Eastern Pacific |
May 15 |
November 30 |
|
Western Pacific |
January 1 |
December 31 |
|
North Indian |
January 1 |
December 31 |
|
South-West Indian |
July 1 |
June 30 |
|
Australian region |
November 1 |
April 30 |
|
Southern Pacific |
November 1 |
April 30 |
Of course storms form all year round so how can we have ‘seasons’?
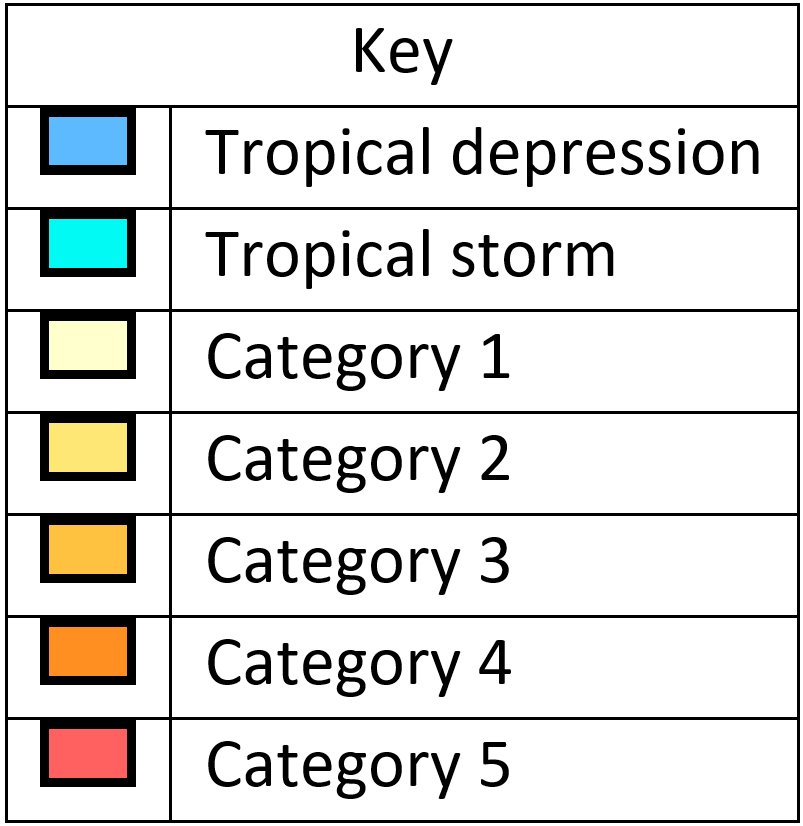
In tropical regions there are three categories of storms (there can be some local slight variations in some countries but most use the American Hurricane definitions) –
- Tropical Depression with maximum sustained winds of 38 mph (62 km/hr).
- Tropical Storm with Maximum sustained winds between 39 mph (63 km/hr) and 73 mph (119 km/hr). Tropical storms are also given names.
- Above 74 mph (120 km/hr) tropical storms are named Hurricanes, Typhoons or Cyclones).
The system of classification (Saffir-Simpson Scale) of Tropical Storms will be looked at in the linked articles. In the main article we are going to look at the record breaking Hurricane Season of 2017.
2017 Atlantic Hurricane Season
Please remember that this edition is written in the first half of October; seven weeks before the normal end of the Atlantic Hurricane season at the end of November.
In the next linked article we will look at how hurricanes form in detail.
2017 Atlantic Named Storms (until 10th October)
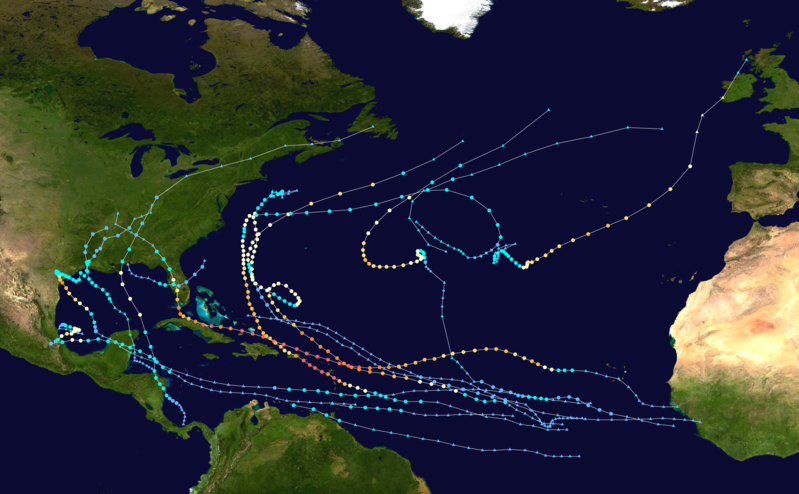
Image: 2017 Atlantic hurricane season summary map - Cyclonebiskit © Wikimedia Commons
- Tropical Storm Arlene - April
- Tropical Storm Bret - June
- Tropical Storm Cindy - June
- Tropical Storm Don- July
- Tropical Storm Emily – July/Aug
- Hurricane Franklin – Aug (Category 1)
- Hurricane Gert – Aug (Category 2)
- Hurricane Harvey - Aug/Sept (Category 4)
- Hurricane Irma - Aug/Sept (Category 5)
- Hurricane Jose – Sept (Category 4)
- Hurricane Katia – Sept (Category 2)
- Hurricane Lee – Sept (Category 3)
- Hurricane Maria – Sept (Category 5)
- Hurricane Nate – Oct (Category 1)
- Tropical Storm Ophelia - Oct
The official Atlantic Hurricane season begins on June 1st but activity started early (April) for the 3rd consecutive year.
Tropical storms and hurricanes form over warm (27˚C+) ocean surfaces; this normally used to happen after the start of June as the summer warmed the ocean surfaces.
Can you think of a reason why things might be changing?

Image: Katia, Irma, Jose 2017-09-08 1745Z–1935Z © Wikimedia Commons
A rare sight three Hurricanes (Katia, Irma & Jose) at one time.
Remember at the time of writing there are still 7 weeks to go until the end of the ‘normal’ hurricane season but already:
- The season has already featured five major hurricanes.
- The highest number since 2010.
- It is already the most costly hurricane season on record.
- It is already the most accumulated cyclone energy (ACE) since 2005.
- 2017 is one of only six years to feature multiple Category 5 hurricanes.
- 2017 is only the second season on record to feature two hurricanes making landfall at Category 5 intensity.
- Irma was the strongest hurricane ever recorded to form in the Atlantic Ocean.
- The season featured the wettest tropical cyclone ever to make landfall in the US (Harvey) and the fastest tropical cyclone ever recorded in the Gulf of Mexico (Nate).
- The 2017 season is also the first season to have four hurricanes make landfall in the United States (Harvey, Irma, Maria, and Nate) since 2005.
Hurricane Harvey
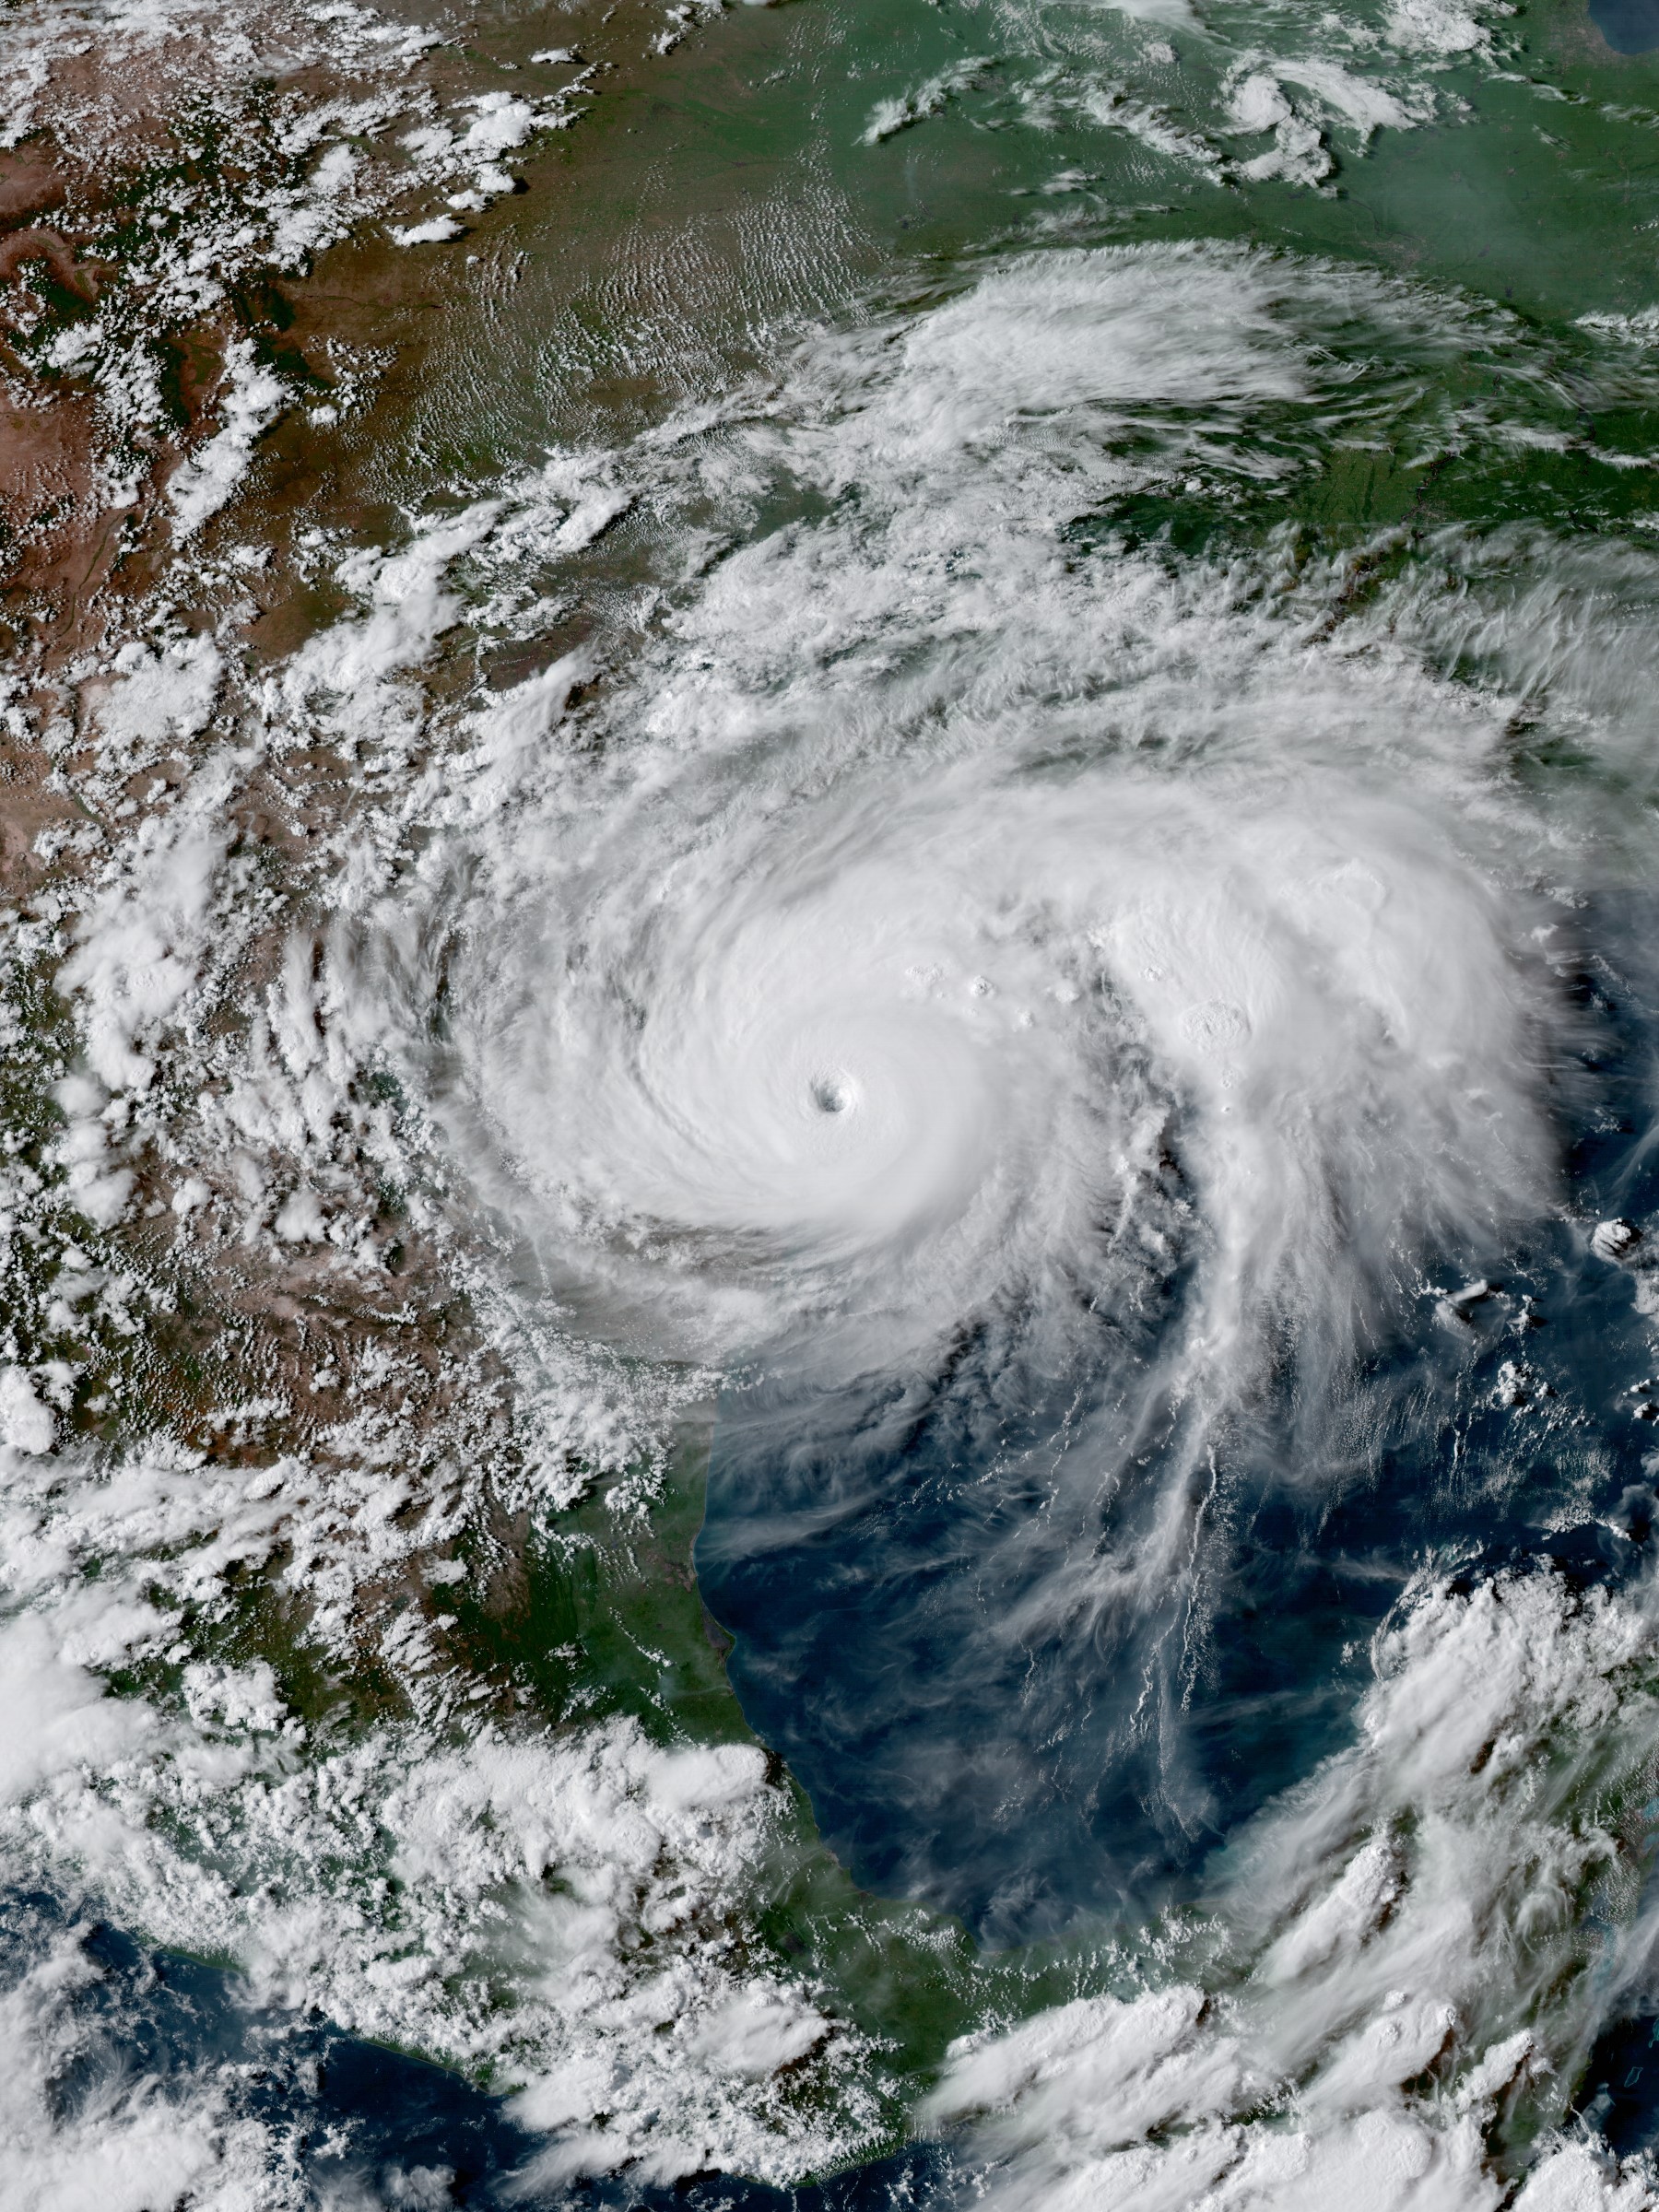
Image: Harvey 2017-08-25 2231Z © Wikimedia Commons
|
Formed Dissipated |
August 17, 2017 September 3, 2017 |
|
Highest winds |
1-minute sustained - 130 mph (215 km/h) |
|
Lowest pressure |
938 mbar |
|
Fatalities |
77 confirmed |
|
Damage |
Approximately $70 billion USD (lowest) to $180 billion USD (highest) – almost all in the USA. |
|
Affected areas; Windward Islands, Suriname, Guyana, Nicaragua, Honduras, Belize, Cayman Islands, Yucatán Peninsula, Southern and Eastern United States (especially Texas & Louisiana). |
|
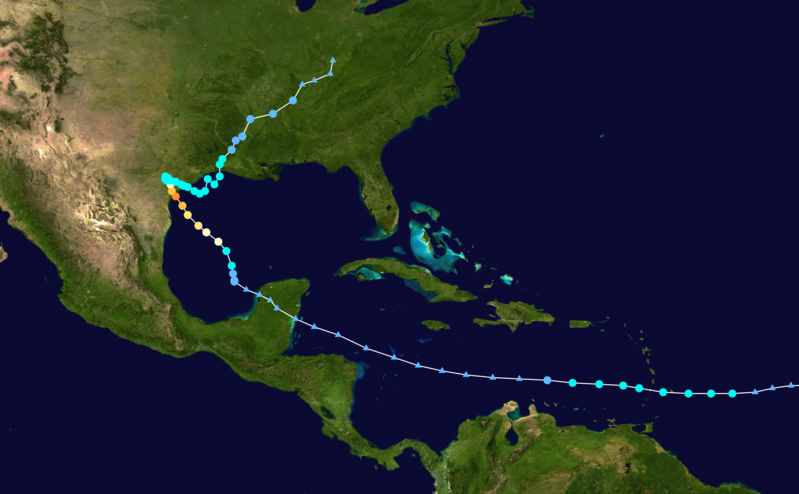
Image: Harvey 2017 track © Wikimedia Commons
Warnings
Texas
- In early September the Texas Governor estimated the total damages will be between $150-180 billion USD.
- Significantly more than the $120 billion USD cost to rebuild New Orleans after Hurricane Katrina in 2005.
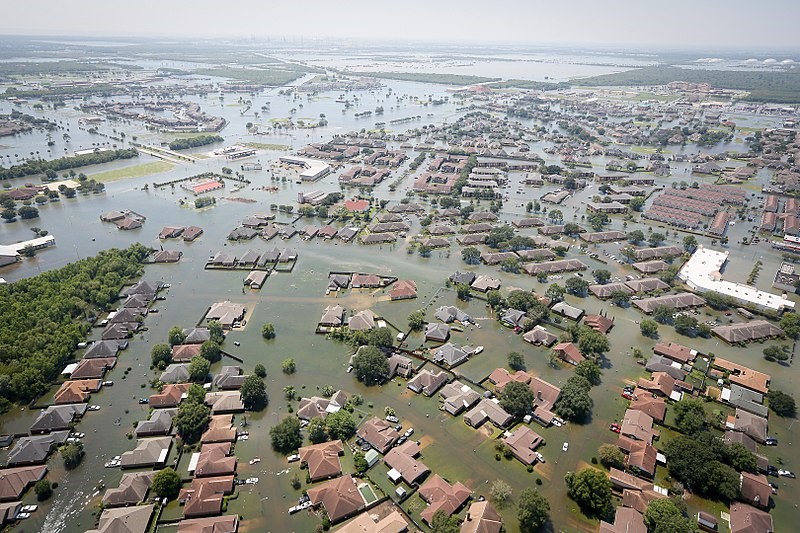
Image: Support during Hurricane Harvey (TX) (50) © Wikimedia Commons
Rainfall
Hurricane Irma
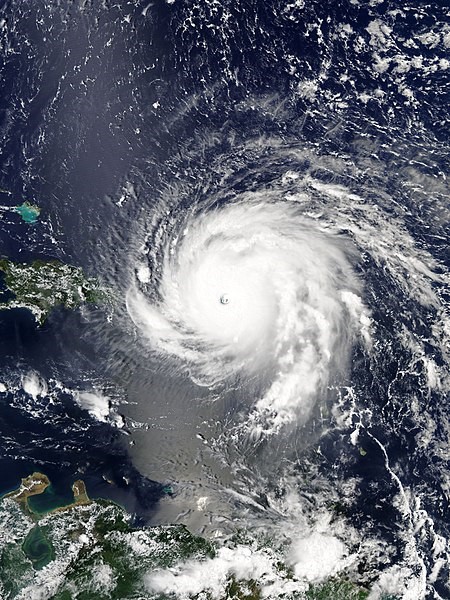
Image: Irma 2017-09-06 1745Z © Wikimedia Commons
|
Formed Peak Intensity Dissipated |
August 30, 2017 September 6th September 16, 2017 |
|
Highest winds |
1-minute sustained - 185 mph (295 km/h) |
|
Lowest pressure |
914 mbar |
|
Fatalities |
132 confirmed |
|
Damage |
At least $63 billion USD. |
|
Affected areas; Cape Verde, Leeward Islands (especially Barbuda, Saint Barthelemy, Anguilla, Saint Martin and the Virgin Islands), Cuba, Puerto Rico, Turks and Caicos Islands, The Bahamas, Eastern United States (especially Florida). |
|
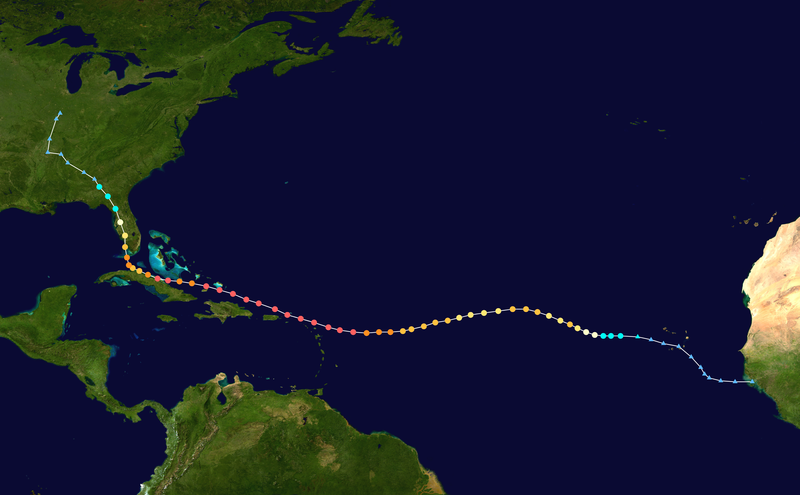
Image: Irma 2017 track © Wikimedia Commons
Irma 5th September as Irma approached the British Virgin Islands on the 6th.
Video: https://commons.wikimedia.org/wiki/File:Hurricane_Irma_5_September_GOES_Floater_Rainbow_IR_view.gif
Virgin Islands group before and after
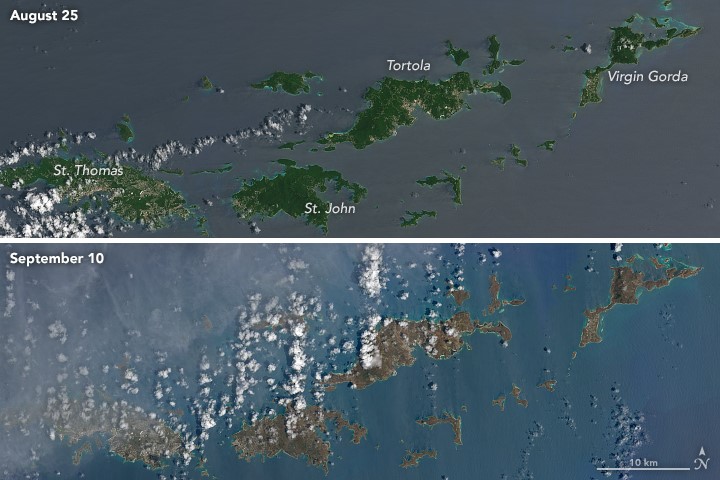
Image: Hurricane Irma turns Virgin Islands brown © Wikimedia Commons
Records
- When Irma reached Category 5 intensity September 5th it became the easternmost Atlantic hurricane of this strength on record.
- On September 6, Irma reached peak intensity with 185 mph (295 km/h) winds and a minimum pressure of 914 mbar.
- This ties it as the second-strongest Atlantic hurricane by wind speed.
- Irma sustained the 185 mph (295 km/h) winds for 37 hours, becoming the only tropical cyclone worldwide to have had winds that speed for more than 24 hours.
- Only four other Atlantic hurricanes have been recorded with wind speeds of 185 mph (295 km/h) or higher:
- Irma achieved one of the longest durations of Category 5 strength winds.
|
Deaths & Estimated Damage By Territory |
||
|
Territory |
Fatalities |
Damage |
|
Anguilla (UK) |
1 |
$290 million |
|
Barbados |
1 |
N/A |
|
Barbuda (AG) |
3 |
$215 million |
|
British Virgin Islands (UK) |
4 |
$1.4 billion |
|
Cuba |
10 |
$2.2 billion |
|
Haiti |
1 |
N/A |
|
Puerto Rico (US) |
3 |
$1 billion |
|
Saint Kitts and Nevis |
0 |
$19.7 million |
|
Saint Martin and Saint Barthélemy (FR) |
11 |
$2.28 billion |
|
Sint Maarten (NL) |
4 |
$2.5 billion |
|
Turks and Caicos Islands (UK) |
0 |
> $500 million |
|
United States |
88 |
> $50 billion |
|
U.S. Virgin Islands |
4 |
$2.4 billion |
|
Unknown |
2 |
N/A |
|
Totals: |
132 |
> $62.9 billion |
Hurricane devastation on the island of Sint Maarten (Netherlands territory).
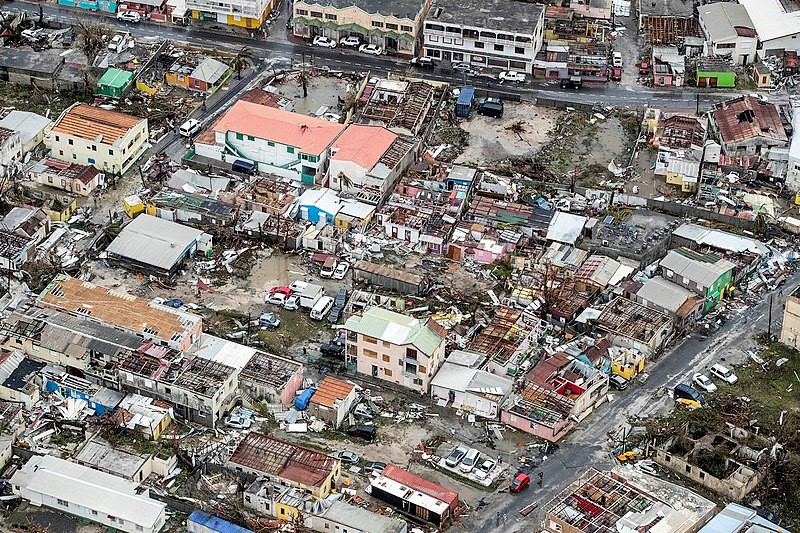
Image: Hurricane Irma on Sint Maarten (NL) 05 © Wikimedia Commons
Hurricane Maria
Hurricane Maria was the tenth-most intense Atlantic hurricane on record.
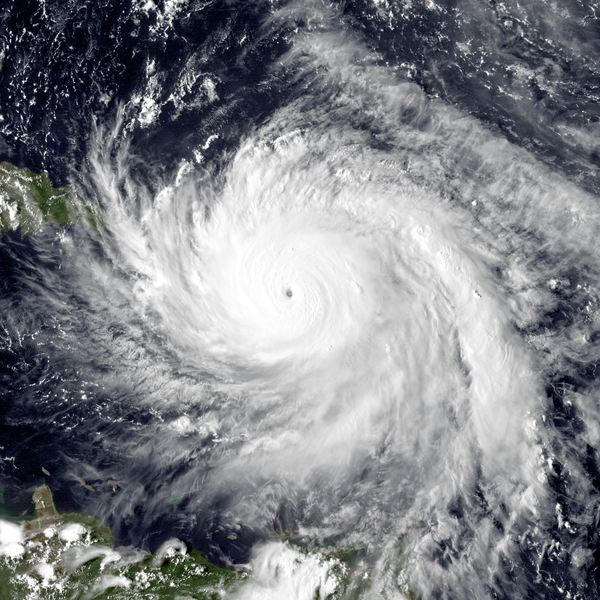
Image: Maria 2017-09-19 2015Z © Wikimedia Commons
|
Formed Dissipated |
September 16, 2017 October 3, 2017 |
|
Highest winds |
1-minute sustained - 175 mph (280 km/h) |
|
Lowest pressure |
908 mbar |
|
Fatalities |
81 confirmed |
|
Damage |
> $51.2 billion USD |
|
Affected areas; Lesser Antilles (especially Dominica and the U.S. Virgin Islands), Puerto Rico, Dominican Republic, Haiti, Turks and Caicos Islands, The Bahamas, S.E. United States, Mid-Atlantic States, Ireland, United Kingdom, France, Spain |
|
- Most costly hurricane in the history of Puerto Rico.
- Worst natural disaster in the history of Dominica.
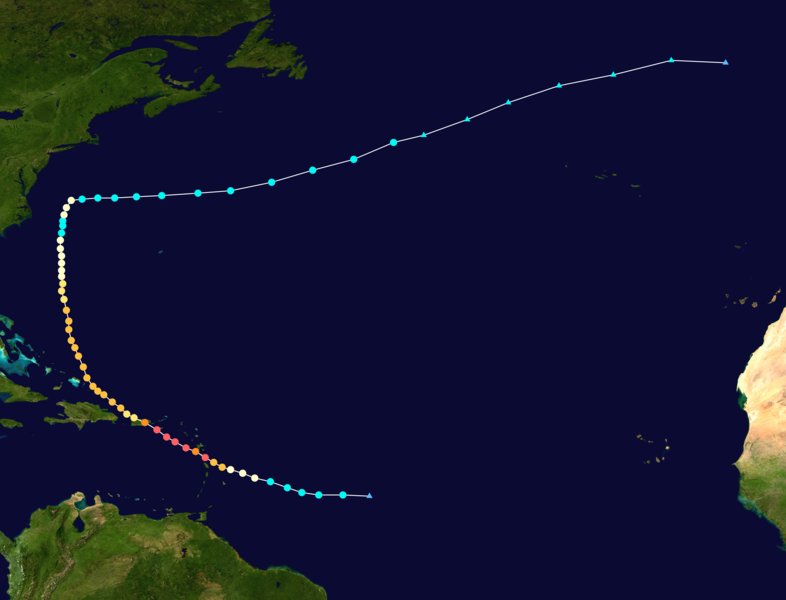
Image: Maria 2017 track © Wikimedia Commons
Satellite imagery as Hurricane Maria makes landfall on Puerto Rico

|
Deaths and damage by territory |
|||
|
Territory |
Fatalities |
Missing |
Damage (USD) |
|
Dominica |
30 |
>50 |
>$1 billion |
|
Dominican Republic |
5 |
1 |
>$63 million |
|
Guadeloupe (France) |
2 |
2 |
$120 million |
|
Haiti |
3 |
0 |
N/A |
|
Martinique (France) |
0 |
0 |
N/A |
|
Saint Kitts and Nevis |
0 |
0 |
$13 million |
|
Puerto Rico (US) |
36 |
>30 |
$50 billion ($90 billion by Governor) |
|
United States Virgin Islands (US) |
1 |
0 |
N/A |
|
United States (US) |
4 |
0 |
N/A |
|
Totals: |
81 |
>83 |
>$51.2 billion |
Puerto Rico at night – before and after.
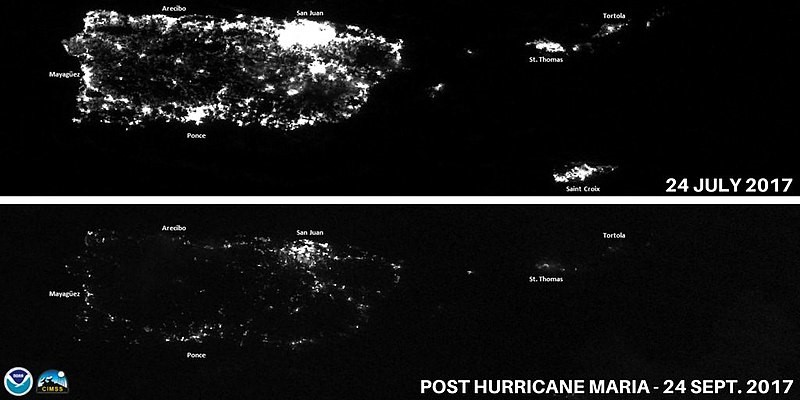
Image: Puerto Rico at night before and after Hurricane Maria © Wikimedia Commons
The Governor of Puerto Rico estimates the cost of repairs at $90 billion USD.
Part of Dominica
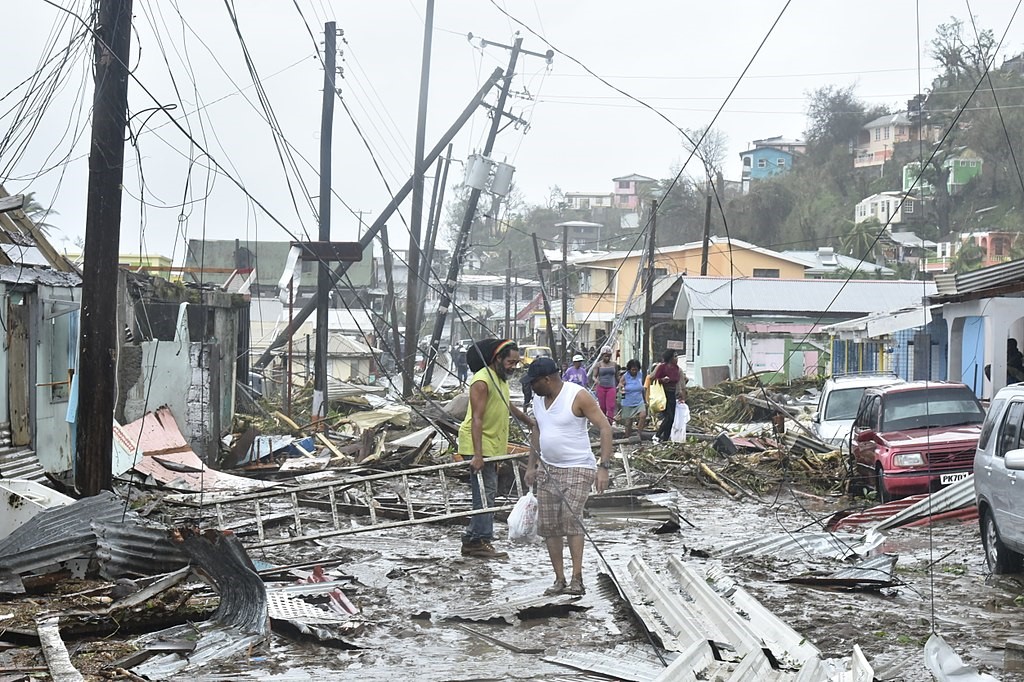
Image: Hurricane Maria destruction along Roseau road © Wikimedia Commons
Hurricane Ophelia Information Box
Hurricane Ophelia became the easternmost Atlantic category 3 hurricane on record.
Tropical Storm Ophelia became a hurricane on 11 October.
Ophelia unexpectedly intensified into a category 3 hurricane on 14 October brushing the Azores with high winds and heavy rainfall.
Unexpectedly and unusually Ophelia headed East wards (and northwards) towards the United Kingdom and the Republic of Ireland.
Ireland suffered a direct hit with Storm Ophelia being the strongest storm to hit Ireland in half a century. Parts of Wales also suffered significant disruption despite not being hit by the centre of the storm.
As of 21 October, at least 51 deaths have been attributed to Ophelia and its remnants; 48 of these were caused by Ophelia spreading wildfires in Spain and Portugal.
The three direct deaths all occurred in Ireland.
Total economic losses from the storm are estimated at close to 1 billion pounds (£ GBP).
Student Activity
- Rank the following hurricanes (Harvey, Irma & Maria) from best (least impacts) to worst (most impacts). Rank them according to:
a. Most lives lost.
b. Fastest sustained wind speeds.
c. Lowest air pressure.
d. Most damage in terms of money. - Suggest reasons why you think a weaker category 4 hurricane such as Harvey might cost more money than a stronger category 5 hurricane such as Irma.
After reading all three articles and carrying out the activities. Use the accompanying A3 sheet to continue the investigation that you started in the last edition.
Teacher Box
The resource is designed to be used as whole class resource from the front of the classroom on the projector/interactive whiteboard. The various graphics should be supported by teacher exposition based on the text which will not be readable in permitted time to the vast majority of pupils), following this it is ideal that the students have access to the online resource in order to work on the activity sheet (designed to be printed on A3 size paper). Ideally these activities will be supported by the use of a network room, tablets/laptops or students own phones/devices if permitted. However the activities are also designed to be used in a typical one hour lesson with the teacher input using the resource from the front of the classroom alongside the resource sheet. Students can then be set a homework task to study the three articles in advance of the following lesson.
The resource and accompanying sheet is designed to support the LNF framework while giving students key geographical knowledge about places in relation to low air pressure.
Pupil Box
Either in class or at home read and complete the activities in the online resource article and in the linked articles in this edition of Geography in the News. Attempt to complete all of the activities in the resource sheet.
What you will learn:
- You will increase your knowledge about low air pressure.
- You will increase your understanding of how these factors may affect human beings and human activities
- You will have you the opportunity to learn or practice important literacy and numeracy skills.
- You will learn new geographical terms highlighted in purple these should be learned and added to a glossary. A glossary is a list of words and their meanings. You could have one in the back of your geography exercise book, if you have a planner it is probably a good place to keep a glossary, or you may keep a separate glossary or word book. A good glossary helps you build your vocabulary and your literacy. Research meanings using related article content, discussion or a dictionary (either online or a book).