Changing Weather and Climate Patterns
Another Poor Summer - Changing Weather and Climate Patterns
http://www.noaa.gov/news/international-report-confirms-2016-was-warmest-year-on-record-for-globe
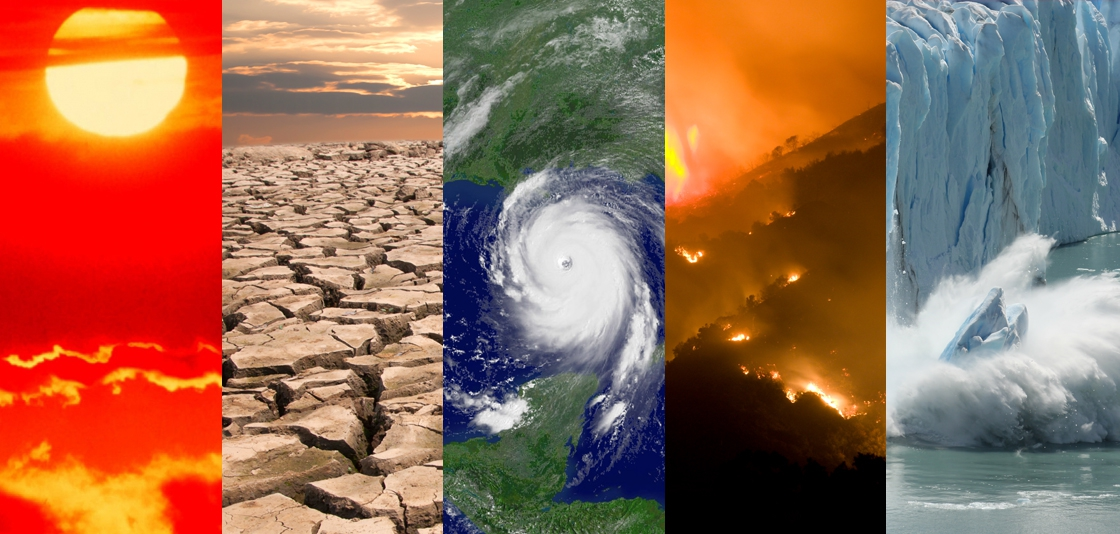
Starter Activity
- Decide on a single adjective that best describes each image.
- Decide on a verb or adverb to go with the adjective.
- Decide on a subject or noun for your sentence.
- For each image write a complete sentence that includes your subject, verb and adjective.
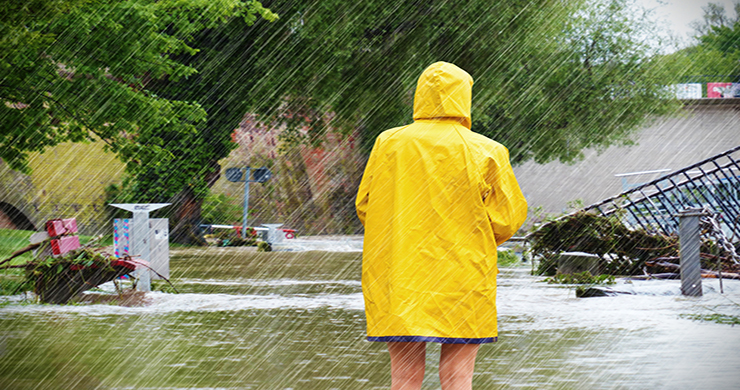
Summer Holiday Washout!
Again!
As the middle of August came and went and the end of the school holidays loomed nearer and nearer teachers and pupils looked out of the windows of Wales at the gloomy skies, wet pavements and the dripping of rain off trees.
Parents watched the weather forecasts each evening or checked phone apps to try and plan the following days for their children. With day after day of showers punctuated by longer days of rain it became harder and harder and more and more expensive to keep the children of Wales entertained.
It may seem that we wait ten months for the summer to arrive and when it does it is rain, rain, rain. But is this true? Why is the news full of stories of global warming, record temperatures, immense wildfires in drought struck Europe and people dying from the heat?
Sadly our gloomy summer weather and storms seems to be how climate change affects Wales for the majority of years while further East and South in Central and Southern Europe deadly heatwaves, droughts and vast fires are becoming the new normal. In GitN this edition we are going to investigate what we have just experienced for another summer in Wales and the other climate news stories from across our continent and beyond
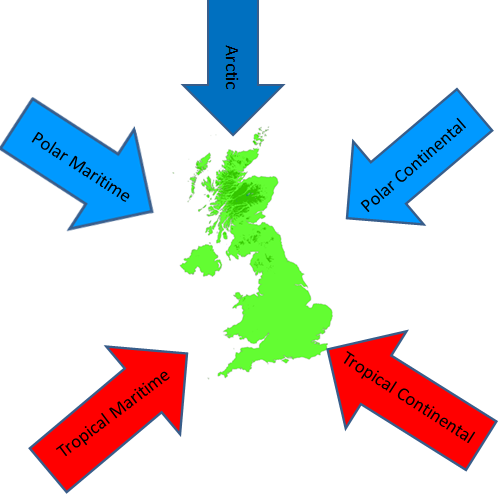
Air Masses
Large bodies of air move from place to place. These large bodies of air are called air masses.They carry with them the characteristics of their source regions.
- Arctic air is very cold
- Polar air is cold
- Tropical air is warm
- Continental air is dry
- Maritime air is wet
Different types of air do not mix easily; the boundary between two different types of air is called a front.
During 2017 and recent summers the UK has been caught in a constant flow of Polar Maritime air which in summer time brings cool temperatures and showers of rain.
As well as the dominant flow of Polar Maritime air there has also been frequent frontal depressions; fortunately in the summer of 2017 they were not too severe.
![]()

Looking at our climate history this is not what we would expect; the path of the storms in summer time should be well to the North of the UK with the Polar Maritime air to the North of the storms.
During the summer Wales would expect the dominant air masses to be Tropical Maritime and Tropical Continental.
Why Have Things Changed?
The path of westerly winds in the North Atlantic is controlled by regions with different air pressure.
Air pressure is the ‘weight’ or mass of air pushing down on the surface.
- Sinking air causes high air pressure.
- Rising air causes low air pressure.
The ‘normal’ or ‘expected’ pattern of westerly winds and storms in the North Atlantic is controlled by:
- A region of high air pressure which develops in the Atlantic around the Azores Islands which are a group of volcanic islands around 850 miles west of the coastline of Southern Portugal.
- A region of low air pressure which develops in the region surrounding Iceland.
In recent years the strength and sometimes the location of these two different high and low air pressure air masses have led to changes in the climate.
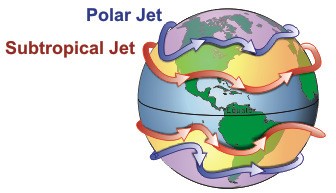
Sometimes the difference in air pressure between the two regions is more than usual sometimes it is less. This affects the path of a large upper air current called the Polar Front Jet Stream.
Contains public sector information licensed under the Open Government Licence v3.0
- A jet stream is a large current of fast moving air 9 – 12 km above the surface.
- Wind speeds of 92 km/hour are normal though speeds of 398 km/hour have been recorded. Speed is controlled by gradient (differences over a short distance – think of it like how steep a hill is) of the air pressure.
- Waves within the Jet Stream (called Rossby Waves) often initiate (start) frontal depressions (storms).
- The Polar Front Jet Stream is found along the boundary between Tropical and Polar air in the North Atlantic.
- The Polar Front Jet Stream is involved in starting frontal depressions and then pulling them westwards across the Atlantic.
Contains public sector information licensed under the Open Government Licence v3.0
The position of the Polar Front Jet Streams controls the path the storms formed along the Polar Front between the warm Tropical Air and the Cold Polar Air.
The position of the Polar Front and the Polar Front Jet stream is controlled by the locations (because they can move) but mostly the strength of The Azores High pressure system and the Icelandic Low air pressure system.
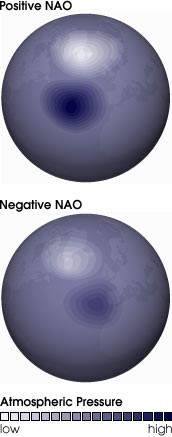
Variations in the strengths and sometimes locations of these two pressure systems is called the North Atlantic Oscillation (N.A.O.)
Contains public sector information licensed under the Open Government Licence v3.0
A bigger difference than usual in pressure is called a positive N.A.O.
A smaller difference than usual in pressure is called a negative N.A.O.
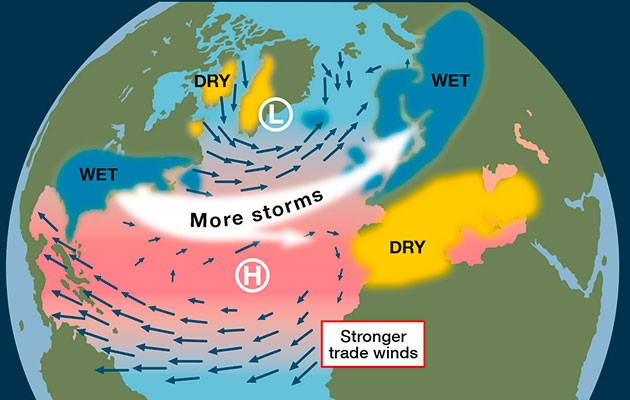
- A high NAO index when there is a stronger than ‘normal’ Azores High and deeper Icelandic low.
- This increased pressure gradient causes:
- Stronger winds
- Generally wilder storms crossing the Atlantic
- Storm tracks which are further north.
- Storms further north causes warmer and wetter weather in Europe keeping the UK on the south side of lows in the warmer south-westerly tropical maritime air.
- The map here shows what we would normally expect in winter but it is now more like the past few summers.
- Wet weather with frequent frontal depressions and showery Polar Maritime air in North Western Europe (UK) and hot dry, drought/heatwave conditions in Southern Europe.
http://www.yachtingworld.com/weather/how-the-north-atlantic-oscillation-affects-european-and-atlantic-weather-105954
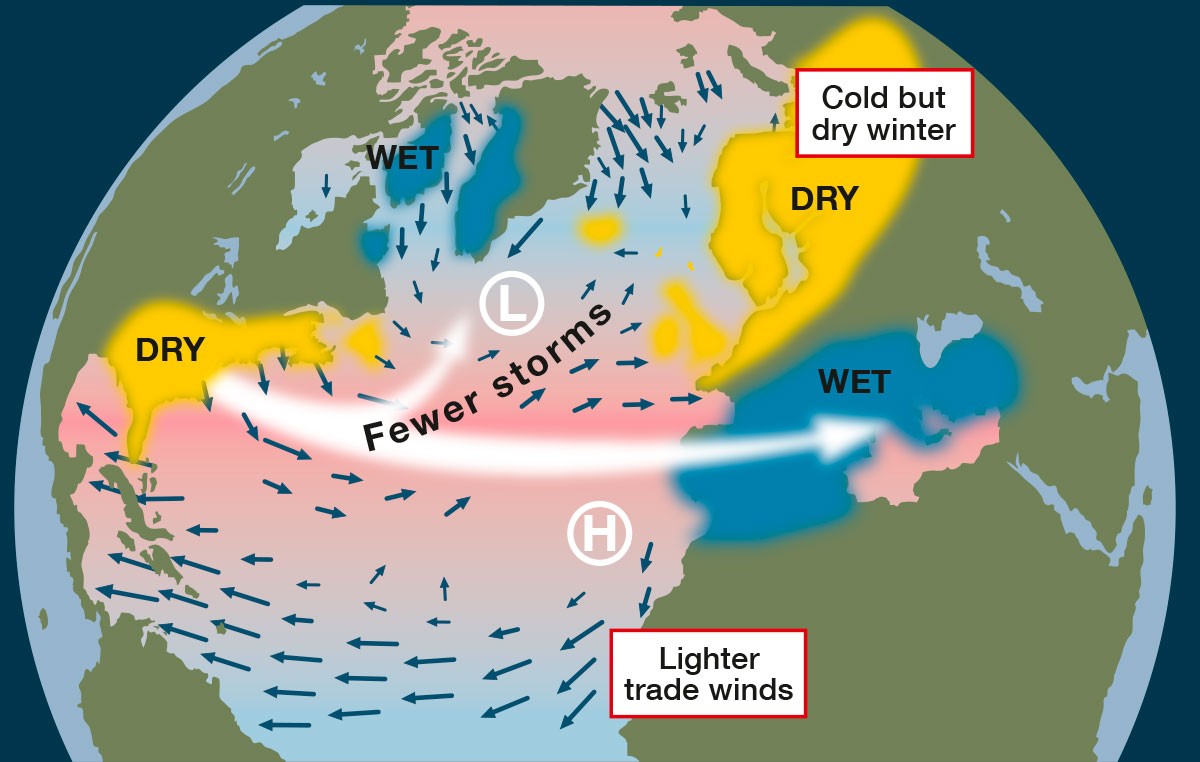
A negative N.A.O. is caused by a less well developed high to the south or low pressure to the north
This weaker pressure gradient and more southerly position of the Azores High means that the winter storms will tend to track further south.
This tends to bring unsettled weather into the Mediterranean and southern Europe while the UK is more affected by cooler and drier Polar Continental air.
This pattern has caused several colder winters for Northern and Eastern parts of the UK in recent winters.
http://www.yachtingworld.com/weather/how-the-north-atlantic-oscillation-affects-european-and-atlantic-weather-105954
Climate Change?
- The Azores High and the Icelandic Low are part of the global mechanisms by which heat moves from the Equatorial Regions to Polar Regions.
- Increased heat could intensify the pressure belts such as the Azores High as more energy is travelling from the hotter Equatorial Regions.
- Warmer surface temperatures around the Arctic caused by more heat absorption by a dark ocean compared to a reflective ice cover leads to:
- Increased warming of the air
- Warm air rises
- Rising air further reduces air pressure.
- Many scientists have recorded evidence that climate change may increase the difference in air pressure between the Azores High and the Icelandic Low putting Wales under the Polar Front Jet Stream during our summer leading to a new wetter summer climate.
Links to other climate news.


As Southern Europe suffered extreme heatwaves, droughts and wildfires the BBC reported news that a study showed things could start getting a lot worse.
A major scientific study claimed that extreme weather could kill up to 152,000 people yearly in Europe by 2100 if nothing is done to stop current rates of climate change and increases reached 3˚C by the end of the Century.
- That is 50 times more deaths than now.
- Heat waves would cause 99% of all weather-related deaths, with southern Europe being worst affected.
- Deaths caused by extreme weather could rise from 3,000 a year between 1981 and 2010 to 152,000 between 2071 and 2100.
- Two in three people in Europe will be affected by disasters by 2100, against a rate of one in 20 at the start of the century.
- There will be a substantial rise in deaths from coastal flooding, from six victims a year at the start of the century to 233 a year by the end of it.
The puppets paid by groups who make their vast fortunes from causing climate change jumped to try again to frame man made climate change as a debate instead of an accepted scientific fact and the president of the USA even officially withdrew from the Paris Climate agreement which was hoped might limit global increases to 2˚C by the end of the century.
Many said that the 3˚C increase the study was based on was too pessimistic but we at GitN prefer to listen to the experts.
At the same time NOAA one of the most respected scientific organisations in the World published its latest report into last year. We will look at it in the linked article.
Student Activity
1. Write a sentence or a paragraph describing what happens when the following air masses pass over a picnic in Wales in summer time. Concentrate on using strong adjectives.
a. Polar Maritime
b. Polar Continental
c. Tropical Maritime
d. Tropical Continental
2. Write another sentence or paragraph on what would happen if the Polar Front Jet Stream were overhead.
a. Hint 1: the Jet Stream is too high to feel it directly.
b. Hint 2: what does the Jet Stream help to start and then carry along?
| After reading all three articles and carrying out the activities, use the accompanying A3 sheet to begin an investigation into changing patterns of climate and weather in Wales and beyond. |
Teacher Box
The resource is designed to be used as whole class resource from the front of the classroom on the projector/interactive whiteboard. The various graphics should be supported by teacher exposition based on the text which will not be readable in permitted time to the vast majority of pupils), following this it is ideal that the students have access to the online resource in order to work on the activity sheet (designed to be printed on A3 size paper). Ideally these activities will be supported by the use of a network room, tablets/laptops or students own phones/devices if permitted. However the activities are also designed to be used in a typical one hour lesson with the teacher input using the resource from the front of the classroom alongside the resource sheet. Students can then be set a homework task to study the three articles in advance of the following lesson.
The resource and accompanying sheet is designed to support the LNF framework while giving students key geographical knowledge about places in relation to changing patterns of weather & climate in Wales.
Pupil Box
Either in class or at home read and complete the activities in the online resource article and in the linked articles in this edition of Geography in the News. Attempt to complete all of the activities in the resource sheet.
What you will learn:
- You will increase your knowledge about changing patterns of weather & climate in Wales.
- You will increase your understanding of how these factors may affect human beings and human activities
- You will have you the opportunity to learn or practice important literacy and numeracy skills.
- You will learn new geographical terms highlighted in purple these should be learned and added to a glossary. A glossary is a list of words and their meanings. You could have one in the back of your geography exercise book, if you have a planner it is probably a good place to keep a glossary, or you may keep a separate glossary or word book. A good glossary helps you build your vocabulary and your literacy. Research meanings using related article content, discussion or a dictionary (either online or a book).