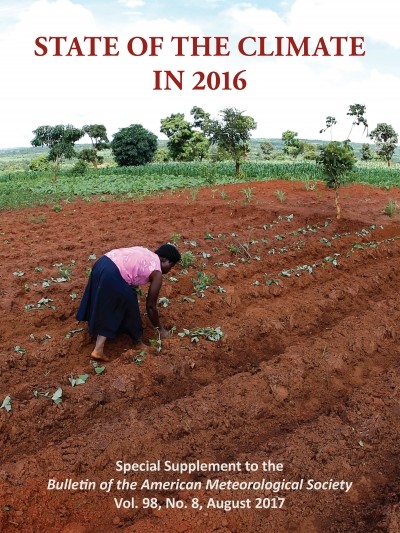
2016 - The State of the Climate
2016 - The State of the Climate
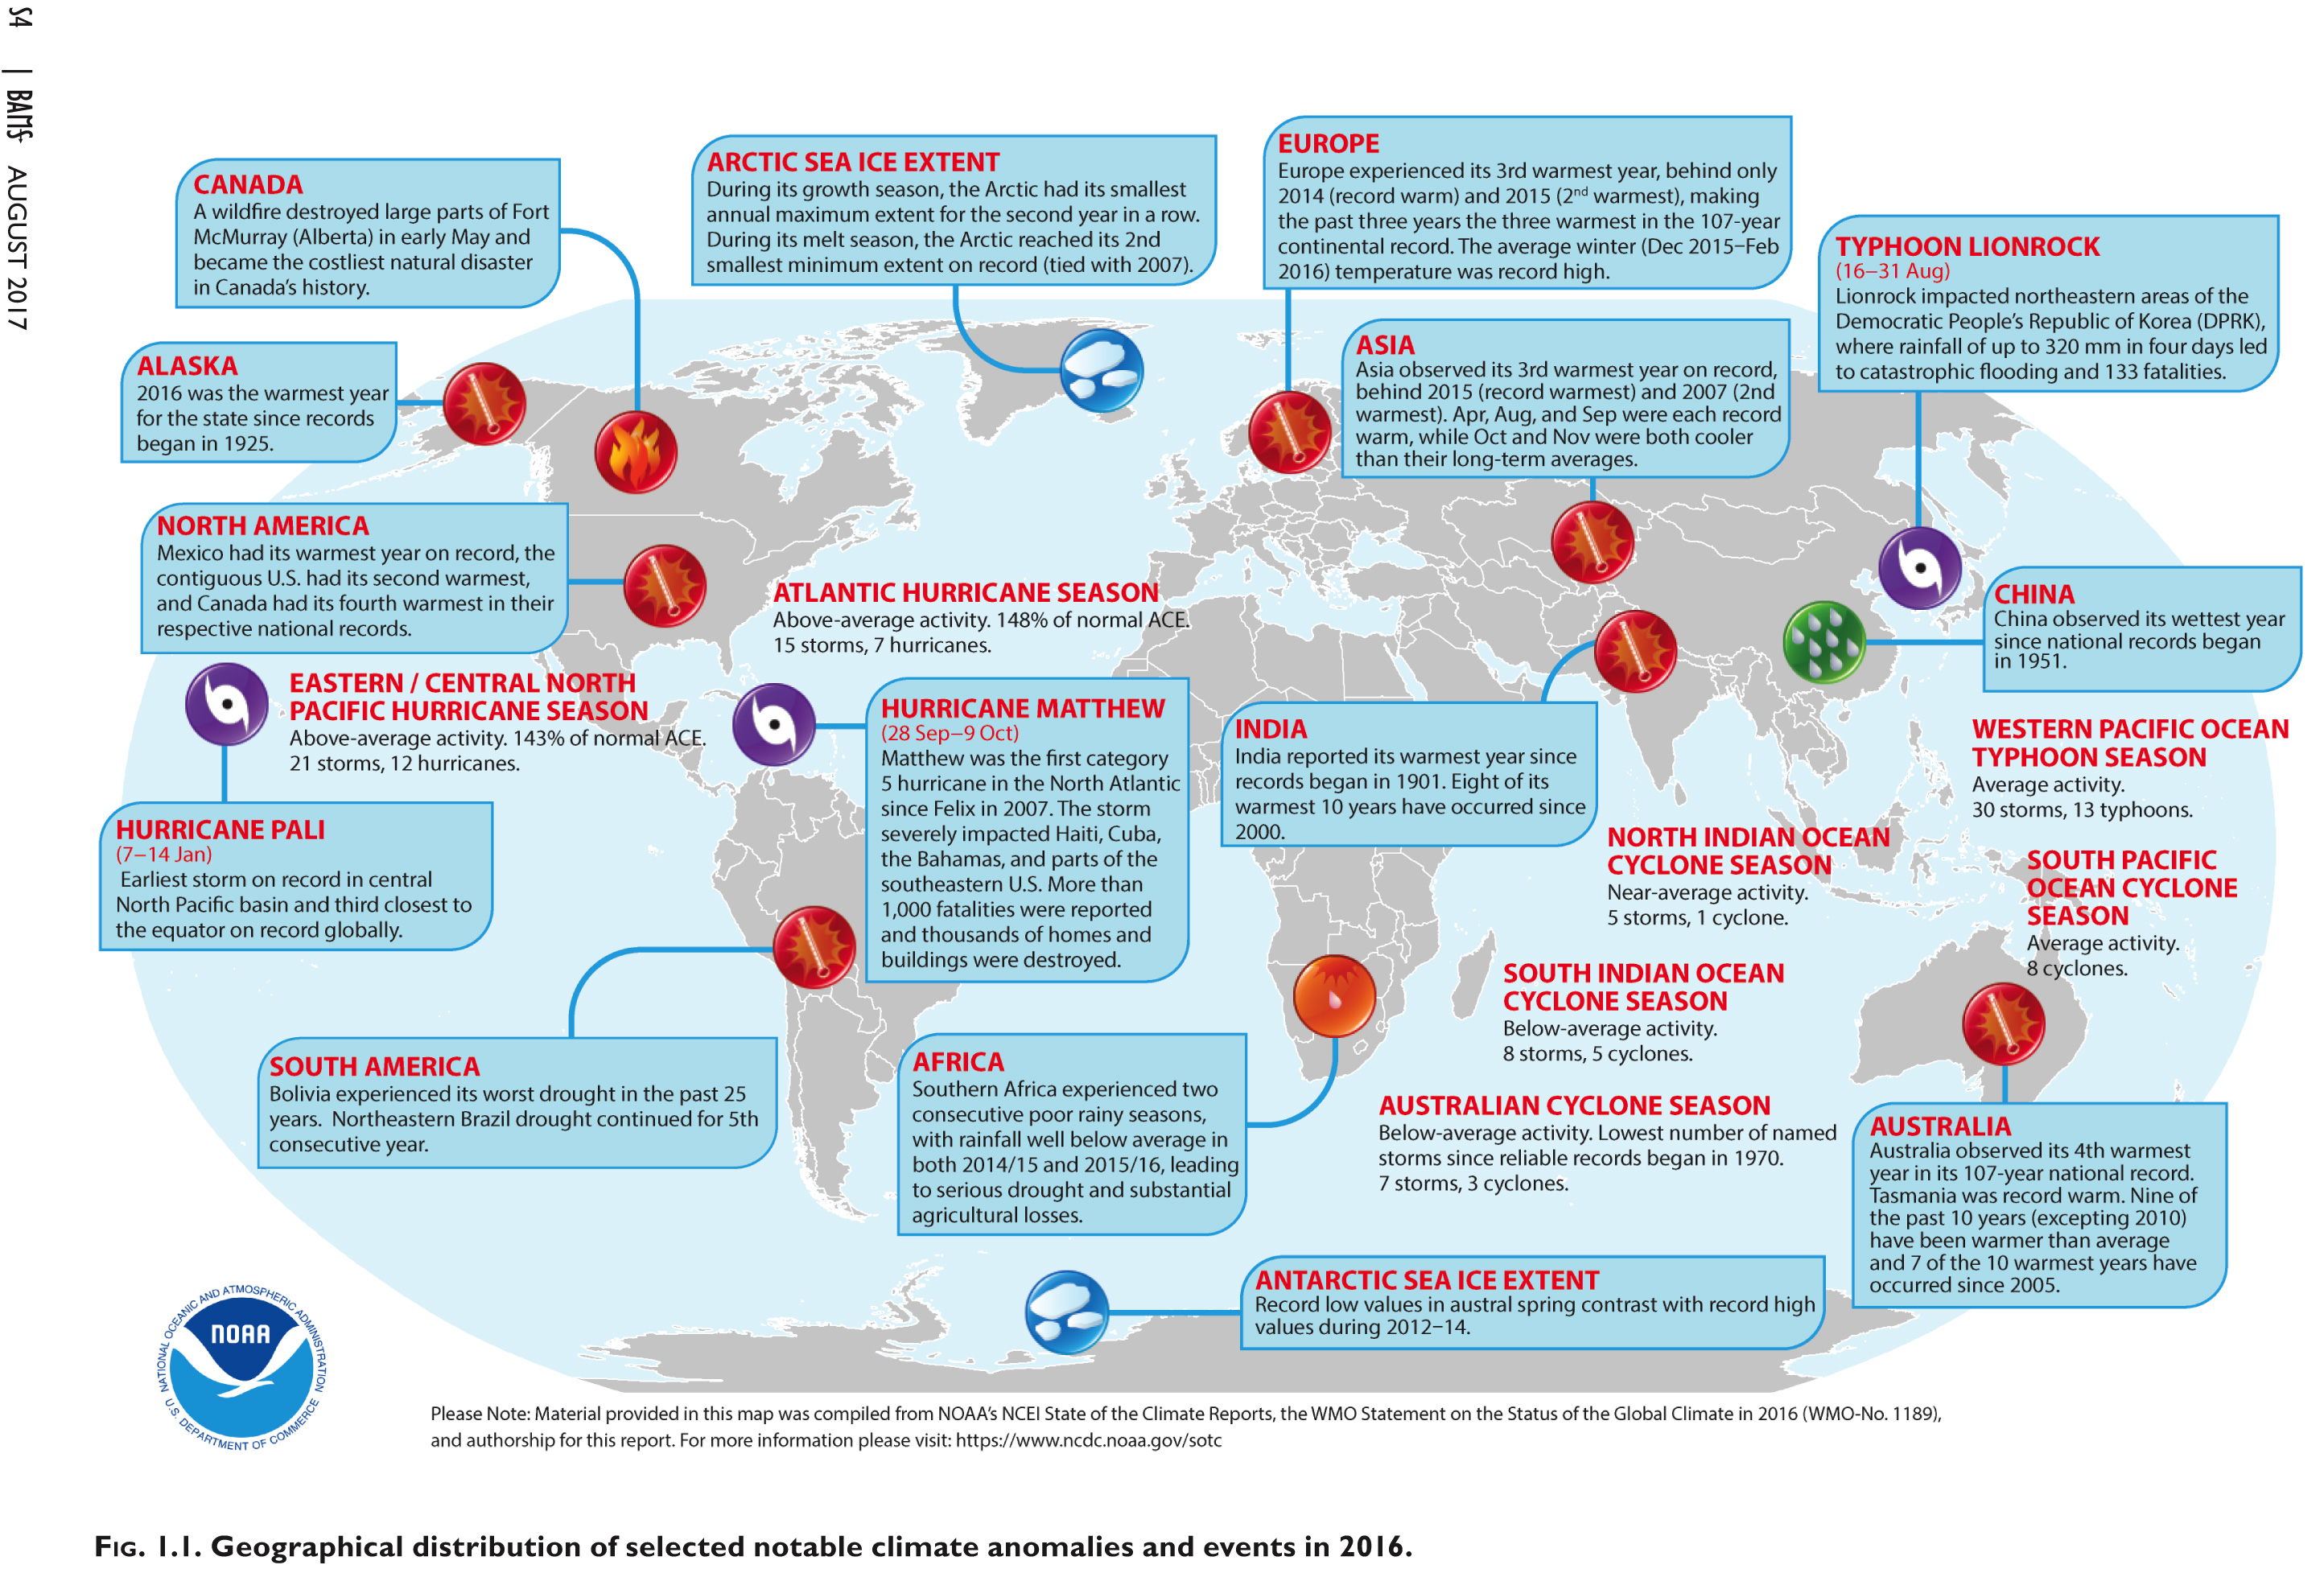
https://www.climate.gov/sites/default/files/bigMajorEventsMap_2016-BAMS.jpg
On the 10th of August 2017 NOAA (National Oceanic & Atmospheric Administration) the United States Federal Agency in charge of climate science released its latest report on the previous year. It makes for ominous reading!
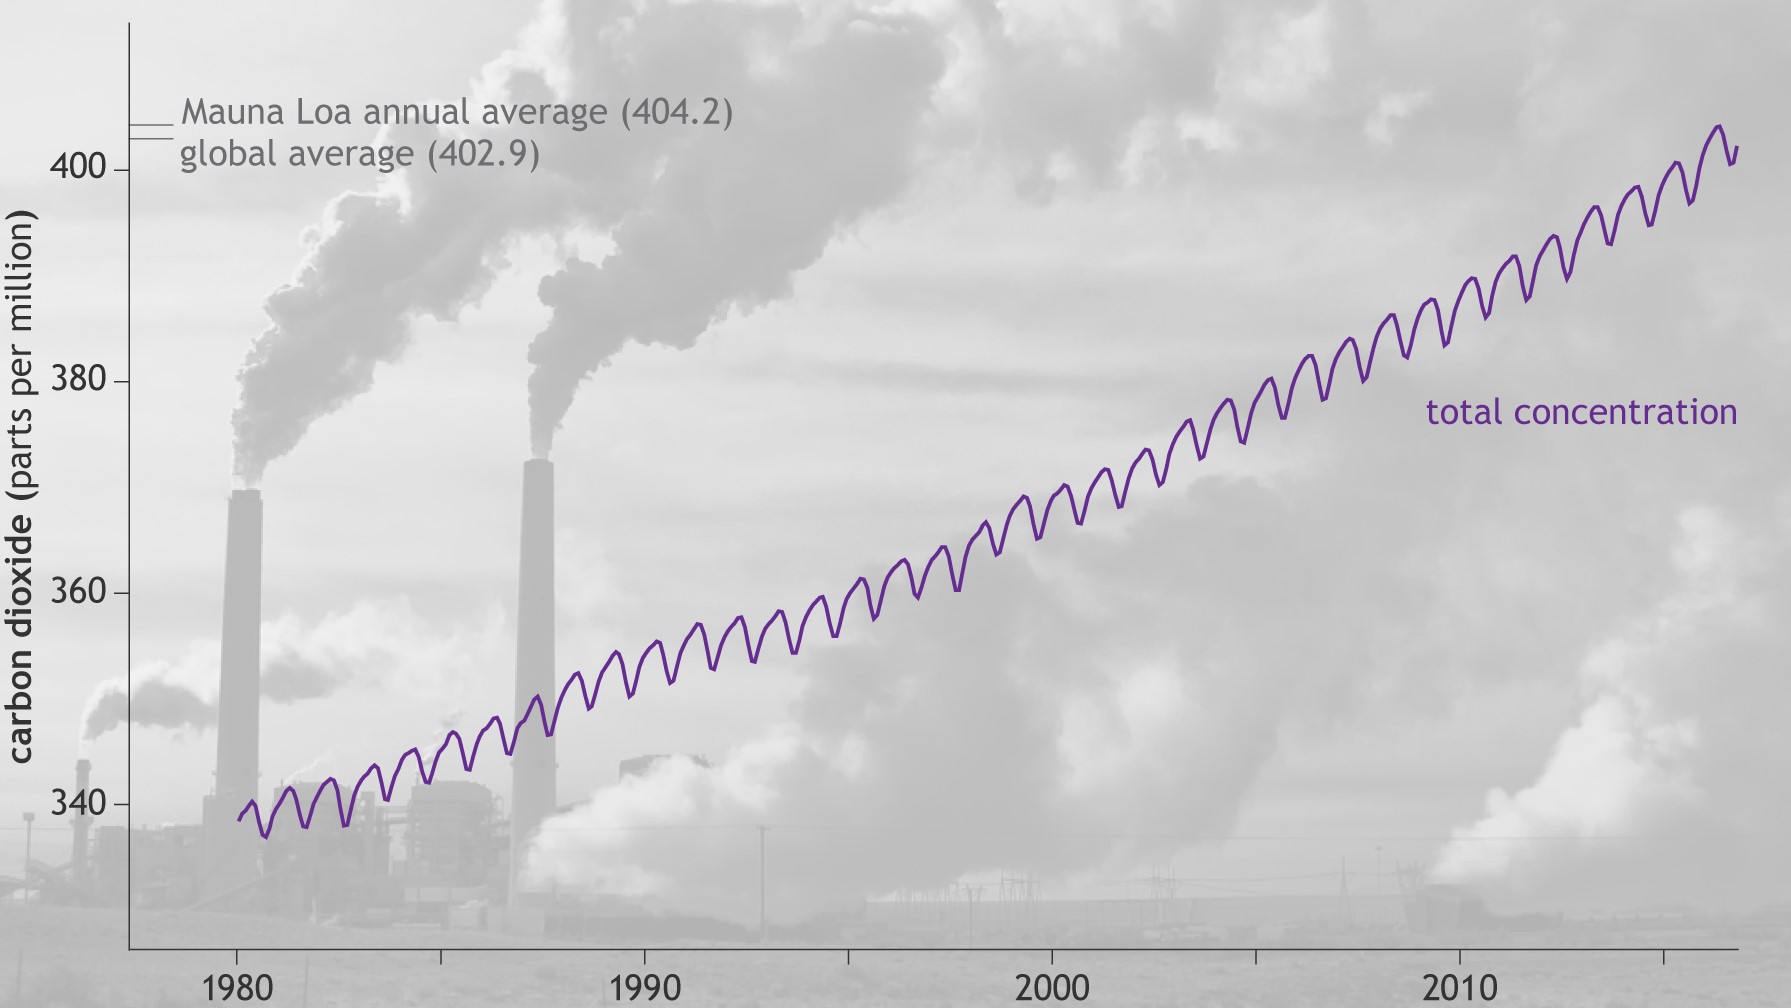
Greenhouse gases were the highest on record.
- Major greenhouse gas concentrations, including carbon dioxide (CO2), methane and nitrous oxide, rose to new record-high values in 2016.
- The 2016 average global CO2 concentration was 402.9 parts per million (ppm).
- An increase of 3.5 ppm compared with 2015
- The largest annual increase observed in the 58-year record.
- The 2016 average global CO2 concentration was 402.9 parts per million (ppm).
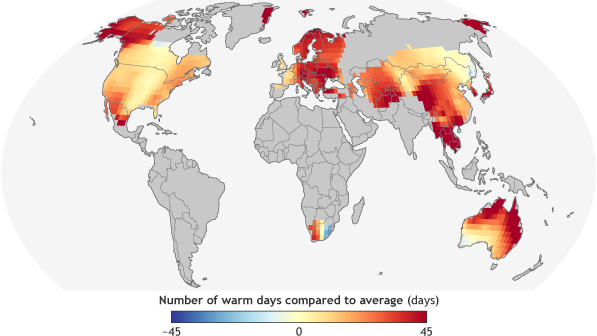
Global surface temperature was the highest on record.
- 2016 was half a degree warmer than the 30 year average ending in 2010.
- The 2016 combined global land and ocean surface temperature was a record-high for a third consecutive year.
- 4 major investigations showed the increase in temperature ranged from 0.45°– 0.56°C above the 1981-2010 average.
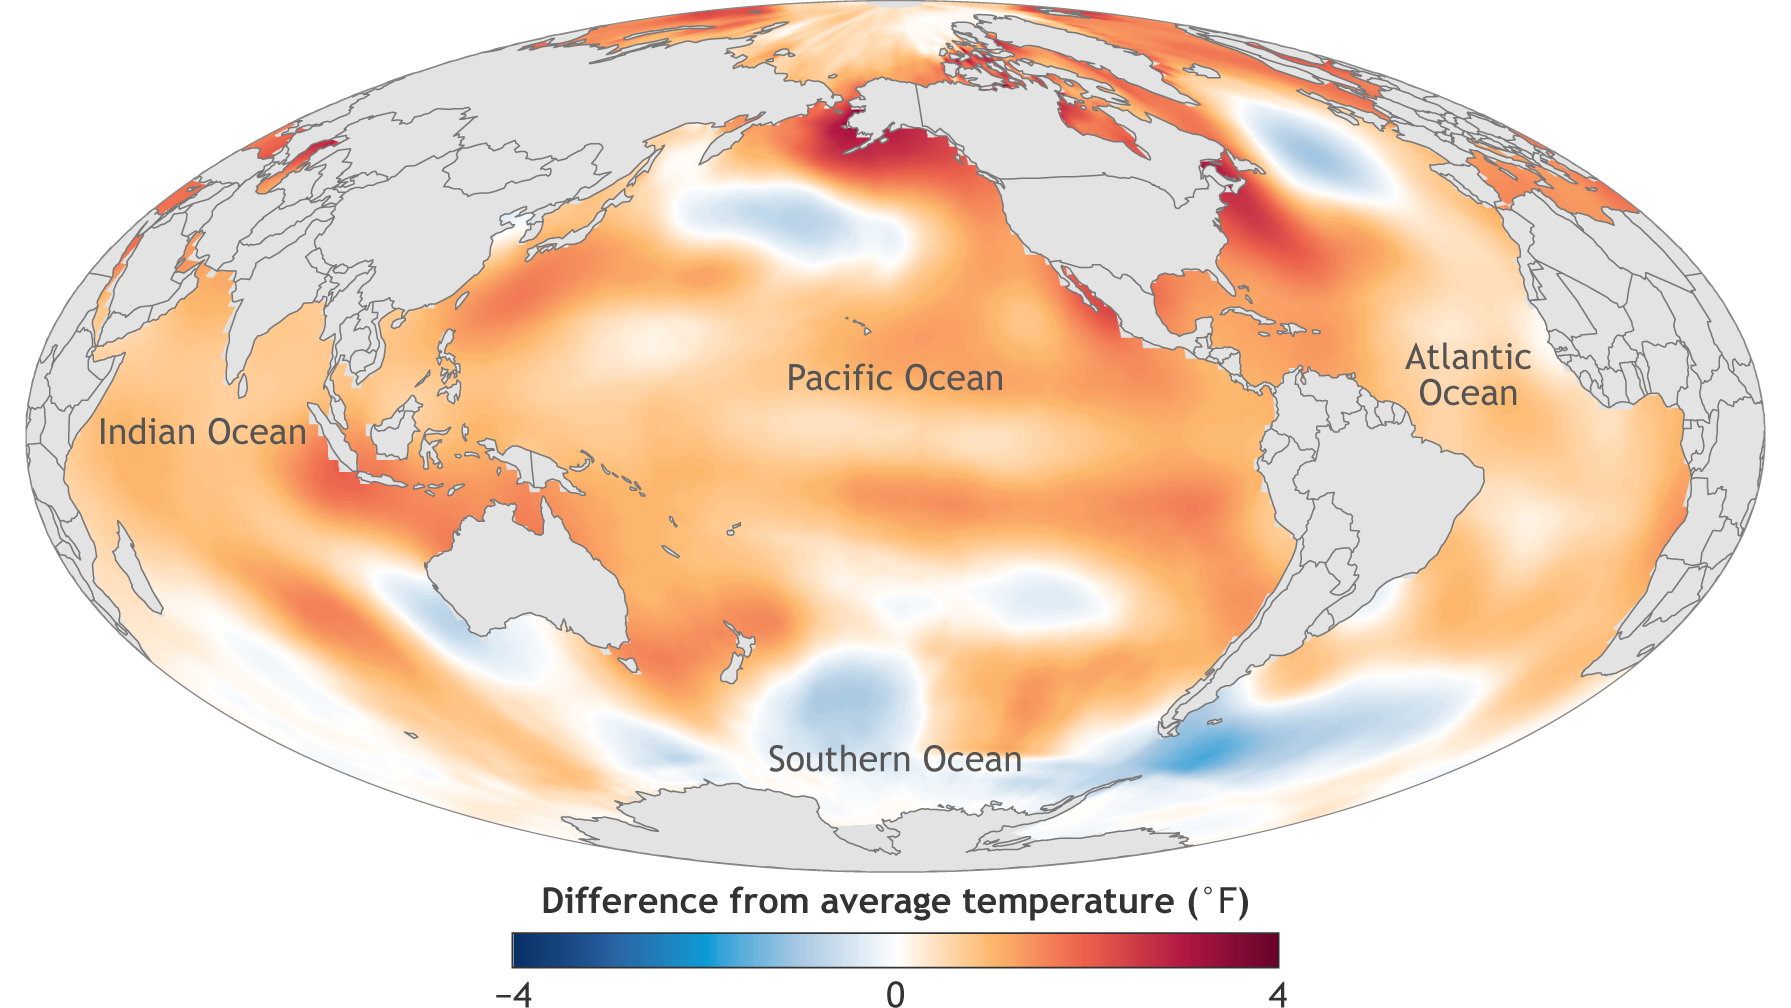
Average sea surface temperature was the highest on record.
- The 4 major studies showed averaged sea surface temperature for 2016 was 0.36 – 0.41 degrees ˚C higher than the 1981–2010.
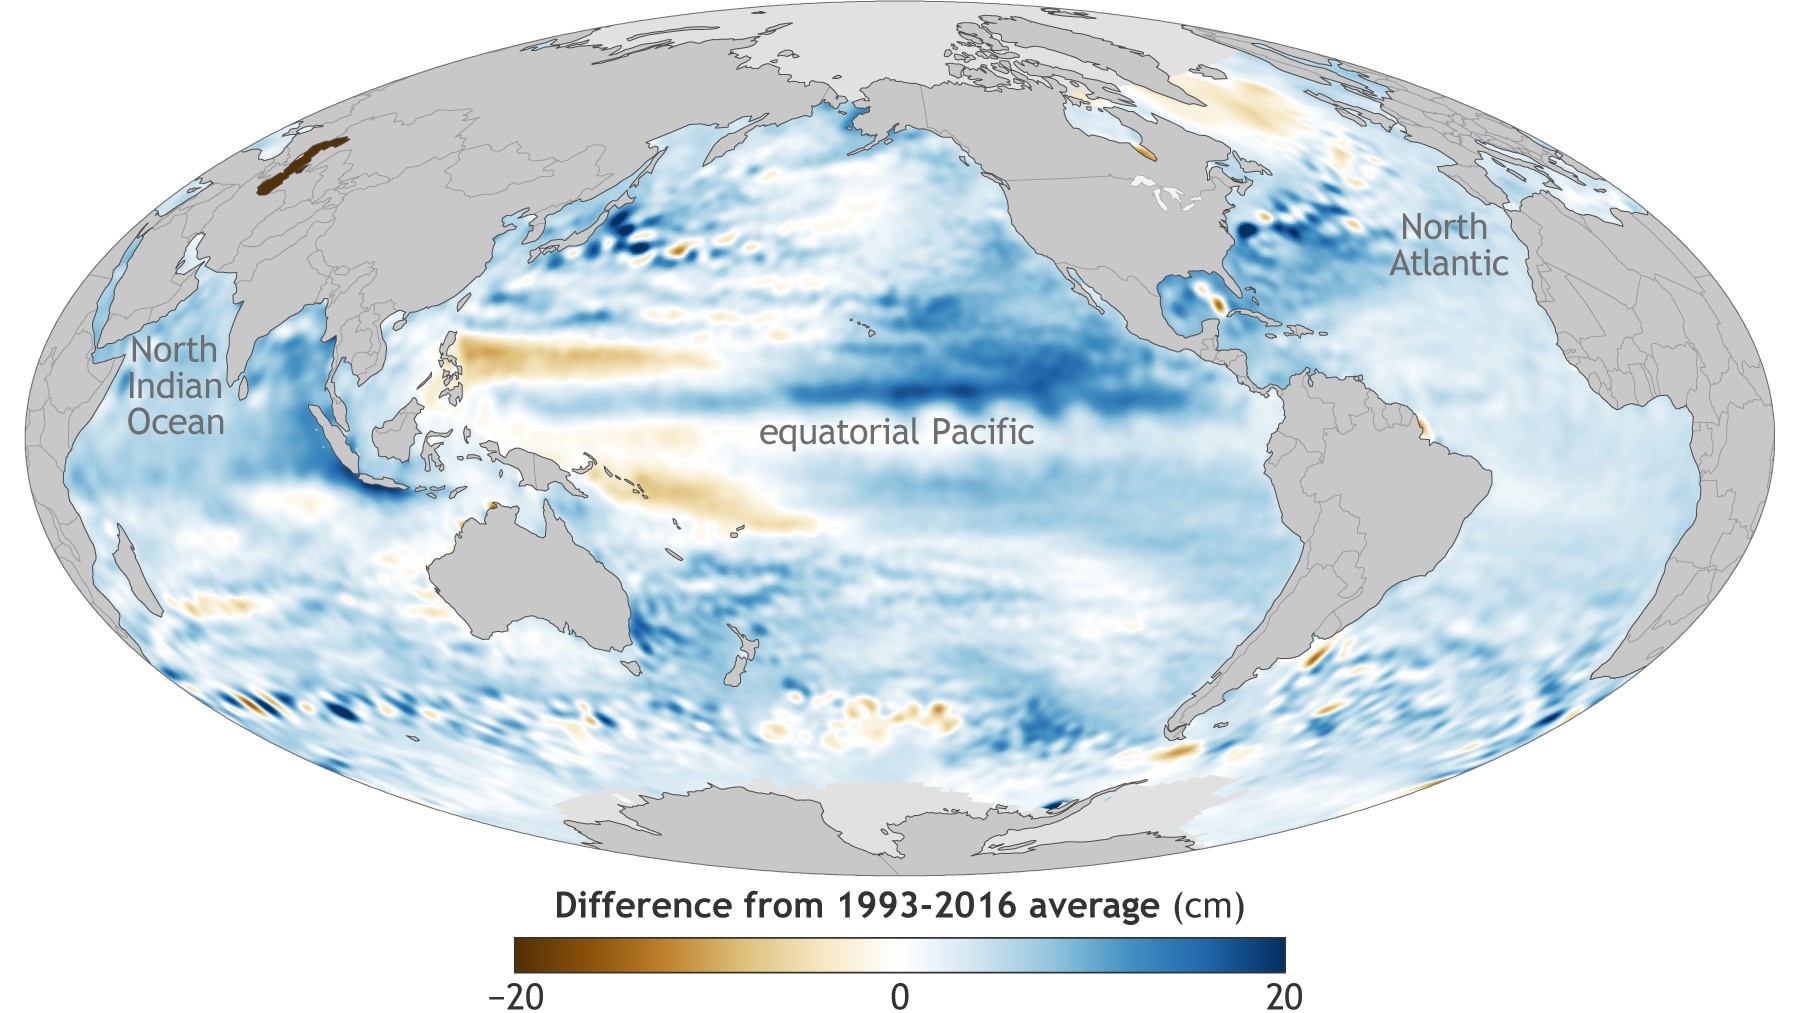
Global sea level was the highest on record.
- The global average sea level rose to a new record high in 2016.
- 82 mm higher than that observed in 1993, when satellite record-keeping for sea level began.
Arctic sea ice coverage was at or near record low.
- The maximum Arctic sea ice extent (coverage) reached in March 2016 tied 2015 as the smallest in the 37- year satellite data record.
- The minimum sea ice extent in September was the second lowest on record.
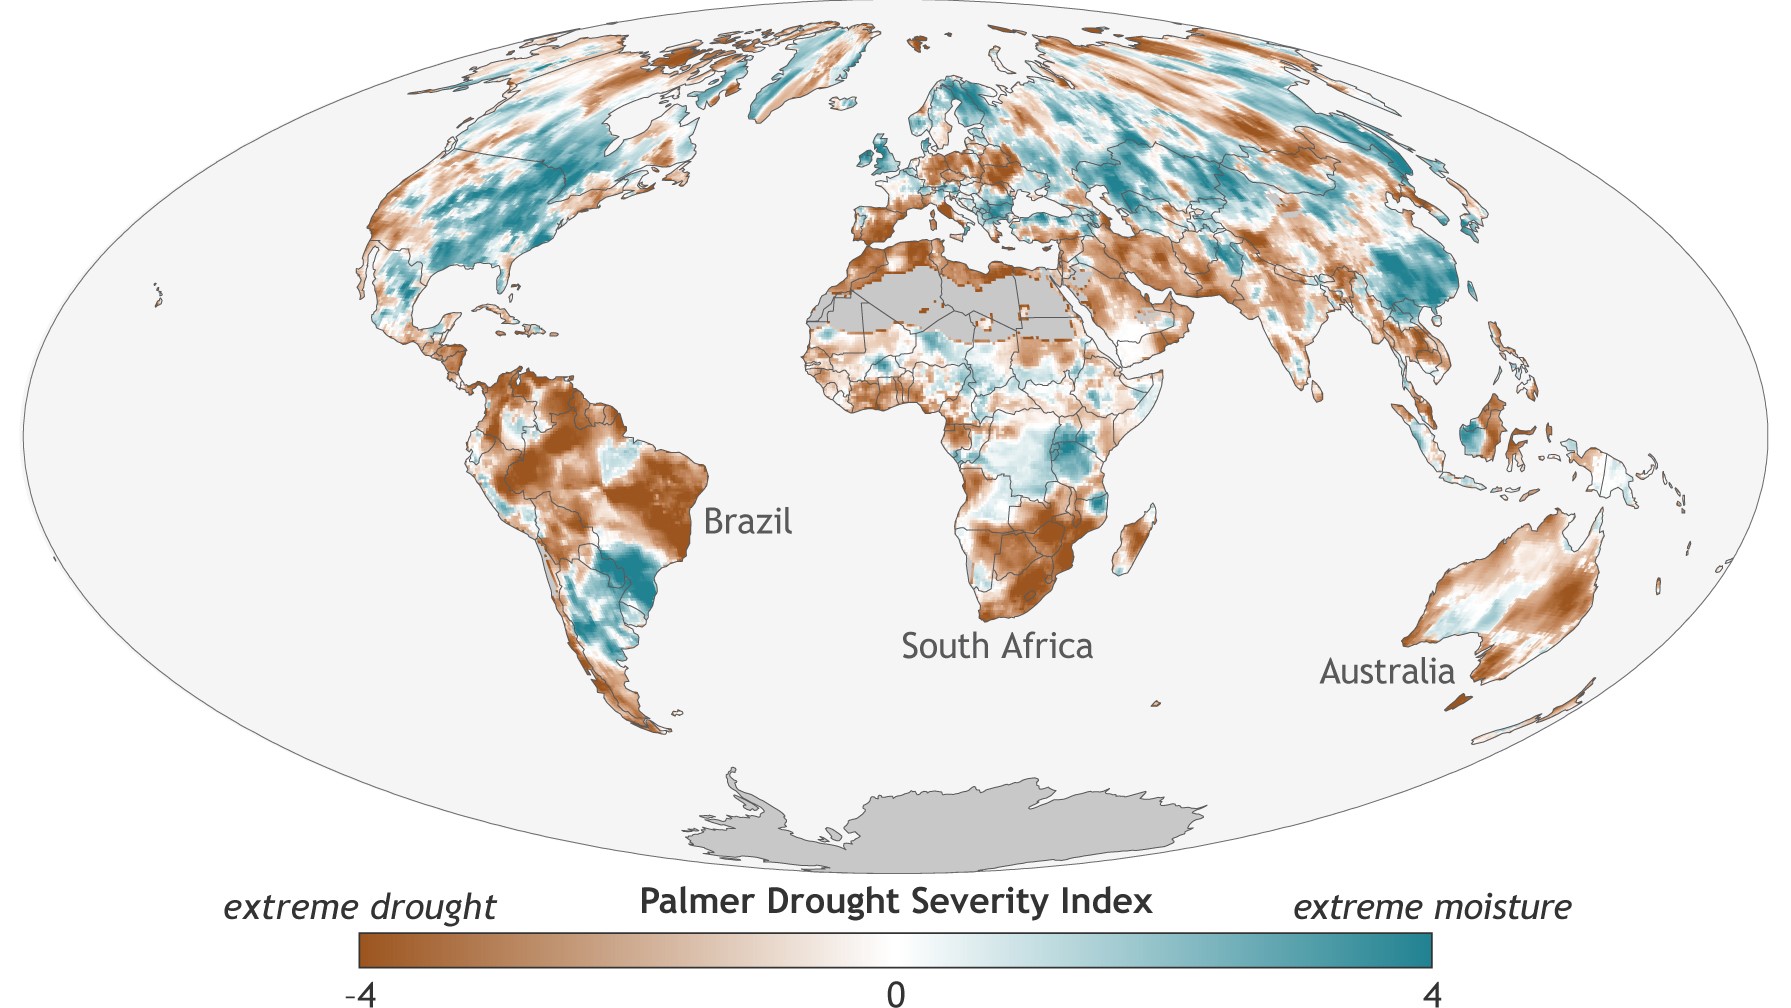
Drought and Floods
- Extremes were observed in the water cycle and precipitation.
- A general increase in the water cycle (the process of evaporating water into air and condensing it as rain or snow).
- Many parts of the globe experiencing major floods in 2016.
- Changes in the water cycle also leads to droughts.
- In any month in 2016 at least 12 percent of global land was experiencing at least “severe” drought conditions.
- The longest such stretch in the record.
- Drought conditions were observed in north eastern Brazil for the fifth consecutive year, making this the longest drought on record in this region.
Tropical cyclones were above-average overall.
- There were 93 named tropical cyclones across all ocean basins in 2016
- The 1981-2010 average is 82 storms.
- Three basins – the North Atlantic and Eastern and Western Pacific basins – experienced above-normal activity in 2016.
In the first article we looked at the recent health study that predicted 152,000 deaths a year due to climate change in Europe by the end of the century.
Many said the 3˚C the study was based on was too pessimistic but the NOAA report based on 4 major studies shows that at the moment 3˚C is not pessimistic at all but at current rates this would be achieved in 35 years not by the end of the century and if current rates continued we could be looking at a 7˚C+ by the end of the century.
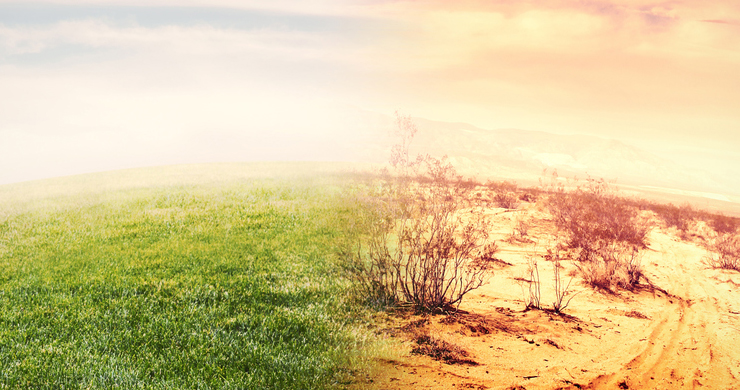
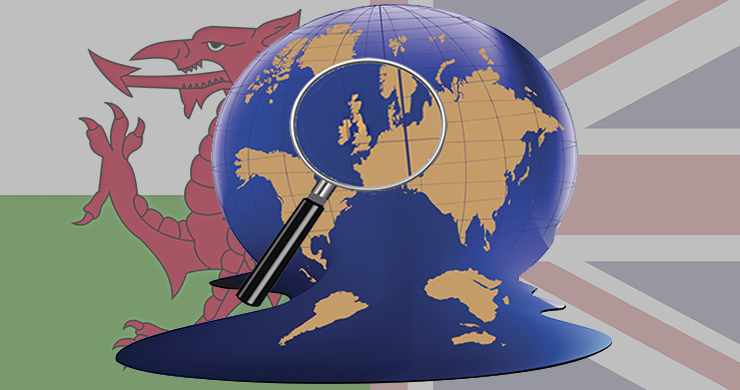
But what is happening in Wales? We have already looked at how our summers seem to be changing but what can we find out from historical records.

Student Activity
Use the bullet points to help you to write one or more sentences to explain the following titles taken from the NOAA report.
1. Greenhouse gases were the highest on record.
2. Global surface temperature was the highest on record.
3. Average sea surface temperature was the highest on record.
4. Arctic sea ice coverage was at or near record low.
5. Changes in the water cycle - Drought and Floods
6. Tropical cyclones were above average overall.