The 2015 General Election
Organise yourselves into 4 groups based on which of the following people you would vote for.
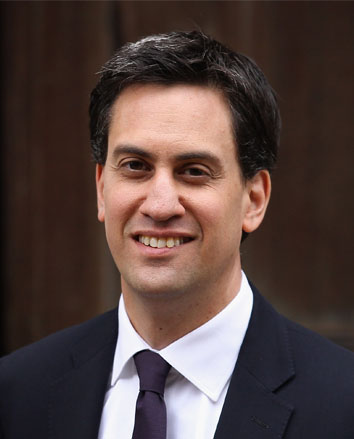
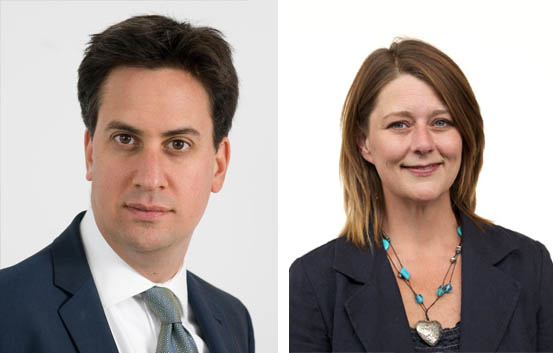
Ed Miliband
Labour Party
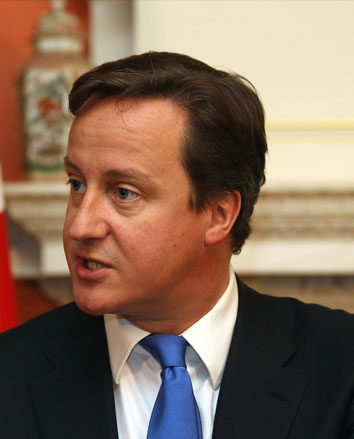
David Cameron
Conservative Party
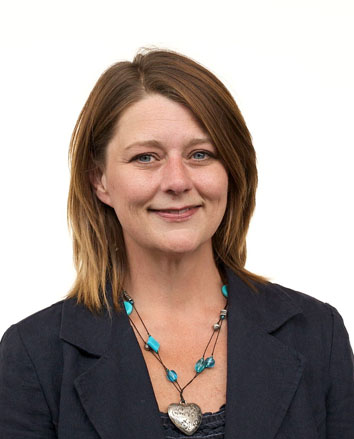
Leanne Wood
Plaid Cymru
Nick Clegg
Liberal Democrat Party
2015 – The U.K. General Election
In 2015 we know that just about the biggest news event will be the General Election. We know that unless Parliament passes a special vote with a majority of 55%, the next General Election will be held on the 7th of May 2015.
This may not seem like a big deal, but it was an important piece of legislation in 2011 called the Fixed-term Parliaments Act 2011 that established this date. Until the new law in 2011 any Prime Minister could call an election at any time (though strictly speaking the Prime Minister advised the Monarch (The Queen) and the Queen called the election); this meant that if a government were popular part way through a Parliamentary term they could call an early election.
This meant that the government could take advantage of something special such as winning a war, or a triumph in an event such as a successful Olympic Games or Football World Cup. To call an early election there has to be a ‘supermajority’ of 55% of M.P.s voting to do so. A government though can still be forced to resign with a normal majority of over 50%; this type of vote is called a ‘vote of no confidence’.
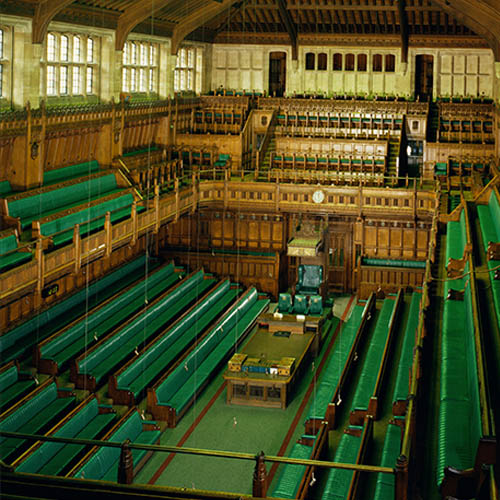
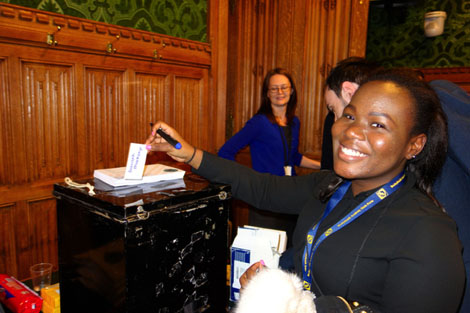 Photo from Parliament Week 2014 by Cabinet Office used under CC BY
Geography in the News and Bias
This edition of Geography in the News has to be worded very carefully as there are strict rules about a government using public money for election campaigning.
Geography in the News is paid for by the Welsh Government, as such it would be unlawful for any aspect of these articles to seem to favour any candidates or party; no matter how big or small.
Private media companies however such as most newspapers and many TV channels are not lawfully bound to be impartial, and instead, will put forward information which supports the political party that the owners prefer; it is very important to always look at such information in the news and analyse it for bias.
We looked at parliament and parliamentary constituencies in the last edition of Geography in the News and how the current government wanted to introduce legislation to reduce the number of parliamentary constituencies from 650 to 600. The current government failed to get this through parliament in time, so the next General Election will have exactly the same constituencies as in 2010. This is an important thing as it is quite common for a new government to change the number or boundaries of constituencies to make it fairer from their own perspective.
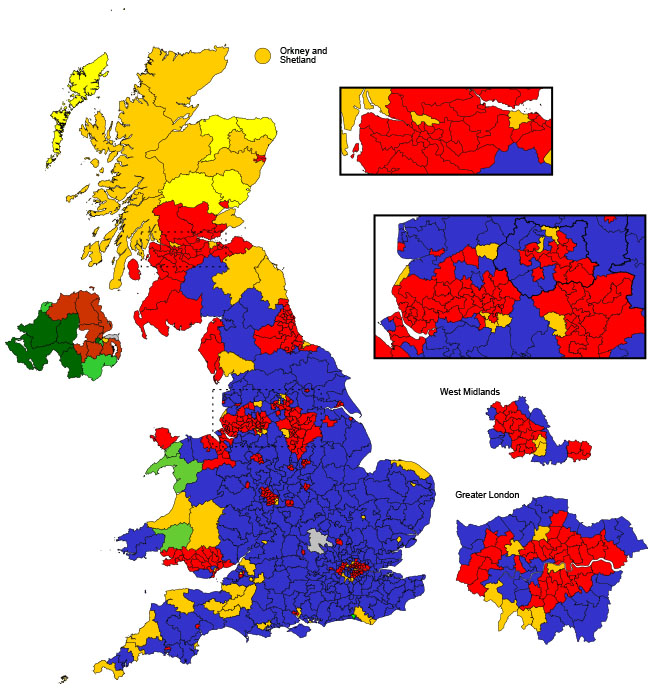
The current government proposed reducing the current 650 constituencies which each represent widely different numbers of voters to 600 constituencies of roughly equal numbers of voters.
This would have reduced the number of M.P.s in Wales from 40 down to 18.
Each parliamentary constituency elects one Member of Parliament (M.P.). This is done by what is called a ‘first past the post’ system;
- This is a horse racing analogy (an analogy in written or spoken communication compares different things, in this case an election and a horse race.
- The idea behind this is to help understand one thing (the election) by comparing it to something which is already understood (the race) which simply means whichever candidate gets the most votes in a constituency becomes the M.P.
| Party | After 2010 General Election | Current |
| Conservative | 306 | 303 |
| Labour | 258 | 257 |
| Liberal Democrat | 57 | 56 |
| D.U.P. | 8 | 8 |
| S.N.P | 6 | 6 |
| Sinn Féin | 5 | 5 |
| Independent | 1 | 3 |
| Plaid Cymru | 3 | 3 |
| S.D.L.P. | 3 | 3 |
| U.K.I.P. | 0 | 2 |
| Alliance | 1 | 1 |
| Green | 1 | 1 |
| Respect | 0 | 1 |
| Speaker* | 1 | 1 |
| Total number of seats | 650 | 650 |
| Actual government majority | 83 | 75 |
| *The Speaker is an M.P. that has the post of being in charge of debates and activity in the House of Commons. The speaker does not vote so is not included in party numbers above. | ||
Government
In the last edition of Geography in the News we looked at the structure of Parliament , so if you are unsure about this then it would be a good idea to go back and check this out.
Parliament and Government are two very different things:
- Parliament has two ‘Houses’ the House of commons which is where M.P.s meet and debate and the House of Lords.
- The House of Commons is the most important; normally whoever has the largest number of M.P.s is given the first opportunity to form a Government. The Government makes all the day to day decisions. Big decisions such as changing the law (legislation) or going to war will also be debated in the Houses of Commons and Lords before being voted on for a decision.
In 2010 the Conservative Party had the most seats but did not have a majority of seats so it joined together with the Liberal Democrat Party to form a Coalition Government.
- The leader of the party which forms the Government will become the Prime Minister who is in charge of the Cabinet; this is the name given to the people who are put in charge of different government departments.
- These people are commonly called Ministers (officially they should be called Secretary of State) so the Minister (Secretary of State) for Education is in charge of the Department for Education.
- The most senior ministers have different titles such as the Chancellor of the Exchequer; who is in charge of the Treasury and makes the big decisions on money in the U.K. After the Chancellor of the Exchequer the next two most senior ministers are the Foreign Secretary and the Home Secretary.
If a party holds 326 seats in the House of Commons then it has an absolute majority (more than half) and can form a majority government. However if no party has this then several different things can happen; currently the largest party is the Conservative Party which negotiated a deal with the third largest party which is the Liberal Democrat Party to form a coalition government.
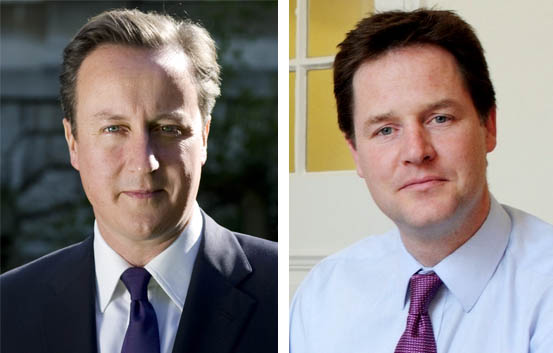
This is where two or more parties form a government together. Currently this is based on a set of policies agreed upon in advance, including sharing important jobs in the Cabinet such as David Cameron the Conservative Party leader becoming Prime Minister and Nick Clegg, the Liberal Democrat Party leader becoming Deputy Prime Minister.
If no group of parties can agree to work together in a coalition government then the largest party may try to form a minority government, this means that they can run the country on a day to day basis but they will need to negotiate support for legislation or decisions which require a vote. These types of government have been quite rare in the United Kingdom but they are very common in many of the countries within the European Union (E.U.).
The largest party not in government is referred to as the opposition party. The opposition party will also appoint a cabinet but is termed the shadow cabinet. Other smaller opposition parties may not have enough M.P.s so will often have a party spokesperson on the relevant issues. In the case of parties restricted to Wales, Scotland and Northern Ireland there may be a cabinet structure made up of assembly members such as in Plaid Cymru in Wales.
The four party leaders for the parties that currently have at least one M.P. in Wales are:
- Ed Miliband – Labour – 26 seats in Wales
- David Cameron – Conservative – 8 seats in Wales
- Leanne Wood – Plaid Cymru – 3 seats in wales
- Nick Clegg – Liberal Democrats – 3 seats in Wales.
One term that you may hear is the term mandate; the mandate of a government is the authority of the government to be in control. The mandate comes from the size of the vote that the party of government receives. At the moment there is a coalition government made up of two parties. The largest party in government whose leader is currently the Prime Minister received 36.1% of the vote in 2010; just over a third of all votes cast in the General Election.
Question - Discuss and Decide
Do you think that 36.1% of votes cast are a strong mandate?
Help
Maybe you could carry out a mock election in your class or year group or divide up your class with 36% (roughly a third) on one side of the room and just under two thirds on the other side of the room. This may help you to formulate your answer.
| Year | Turnout % |
| 2010 | 65.1 |
| 2005 | 61.4 |
| 2001 | 59.4 |
| 1997 | 71.4 |
| 1992 | 77.7 |
| 1987 | 75.3 |
| 1983 | 72.7 |
| 1979 | 76 |
| 1974 Oct | 72.8 |
| 1974 Feb | 78.8 |
| 1970 | 72 |
| 1966 | 75.8 |
| 1964 |
77.1 |
| 1959 | 78.7 |
| 1955 | 76.8 |
| 1951 | 82.6 |
| 1950 | 83.9 |
| 1945 | 72.8 |
Combined with the proportion of votes cast giving a mandate there is another issue which is called voter turnout. This is the proportion (share) of voters who actually vote. In the 2010 General Election the turnout was 65.1% or just under two thirds. So the winning party which formed the government actually had roughly a third of two thirds.
Question - Discuss and Decide
How do you think low voter turnout affects the mandate of the winning party to govern the U.K.?
Help
Try this exercise in your class, take ten people (you can easily scale this up to use 20 or 30 people) and take out three people who stand on one side of the room. Of the seven people who are left take a third of them, which is two or three of them, and send them to the other side of the room. The remaining four or five people can stay in the middle of the room. You can now roughly visualise those who voted for the party now in power, how many voted for someone else and how many did not vote at all.
Student Activity
Investigation
First try to read the rest of the linked resources and attempt use the student resource sheet to help you carry out an investigation of the geography of the 2010 General Election and to formulate questions which you can follow up after the results are in for the 2015 vote in May.
Introduction
- In this section you will explain what it is that you are investigating.
- You will choose questions for enquiry that you want to answer.
- You will explain important background information.
- Outline a plan of what you intend to do and what data you will collect.
Results
- Tabulate (put in tables) data.
- Convert the data into easier forms to interpret:
- Use graphs
- Simplify data into things like rounded numbers or a representative mean.
Analysis
- Show how your results answer your questions for enquiry:
- Annotate graphs and diagrams
- Construct paragraphs.
Conclusions
- For each of your enquiry questions what have you found out? What is the answer?
Methodology
- Often the Methodology follows the Introduction as you explain what you plan to do. In this investigation we are going to place the Methodology before the Evaluation so that we can better develop our evaluative skills for the future.
- You will explain how you gathered your data and justify your choices.
- You will explain how you represented your data and justify your choices.
Evaluation
- Evaluate your process (how you carried out your investigations (methods)) – what was successful? What went wrong? What could you do differently next time?
- Evaluate your sources – (your information and data) which are reliable and why? Which might be biased and why?
- Evaluate your outcomes – (your conclusions) what is reliable and why? Which may be wrong or inaccurate and why?
- Formulate more questions for a future enquiry based on your findings; this is especially important to find out if your predictions may be correct after the election.