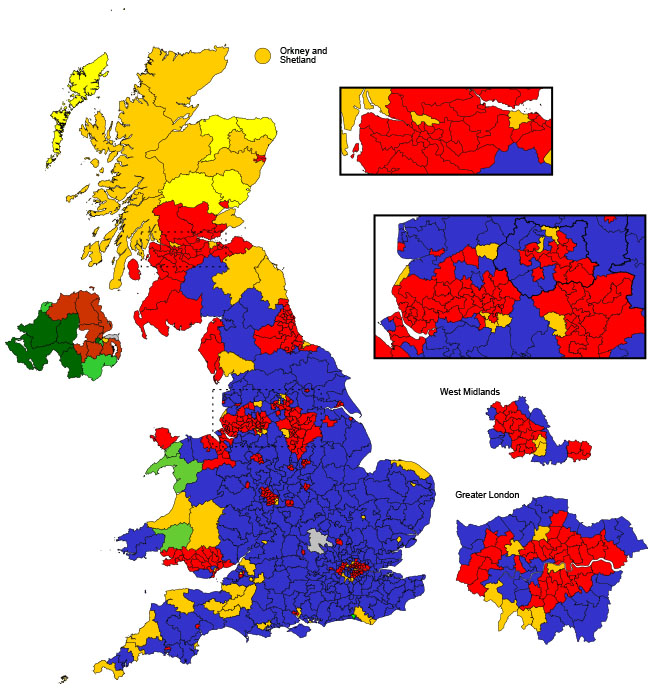
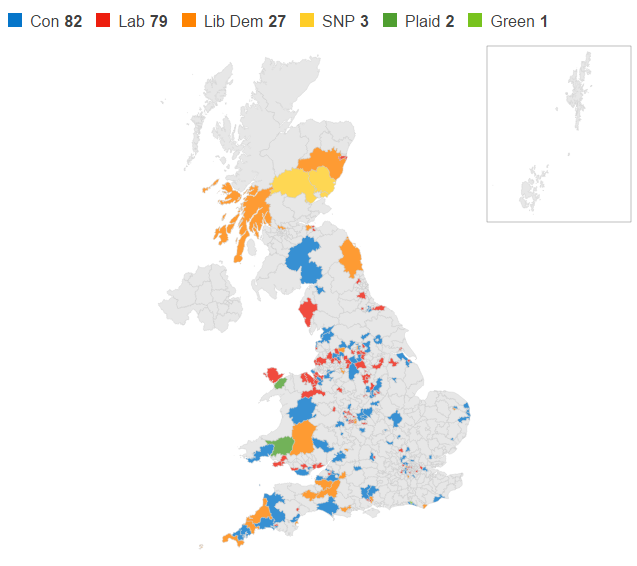
Geographical Distribution of Seats in 2010
Look at this map of election results from 2010 it is easy to see distinct patterns. Mostly blue areas (Conservative) are grouped together covering much of England. Red areas (Labour) are also grouped into former industrial areas and many urban constituencies. Other parties are more spread out, such as the darker yellow of the Liberal Democrats, the brighter yellow of the S.N.P. in Scotland, and the green of Plaid Cymru in Wales. In Northern Ireland there is a clear division between the green republican parties and the brown unionist parties.
In the last edition of Geography in the News we looked at human geography; an important part of human geography is the study of population. When studying populations we can look at population density which is how many people live on an area of land. Population density is calculated by dividing total population by total area to give a value per km2.
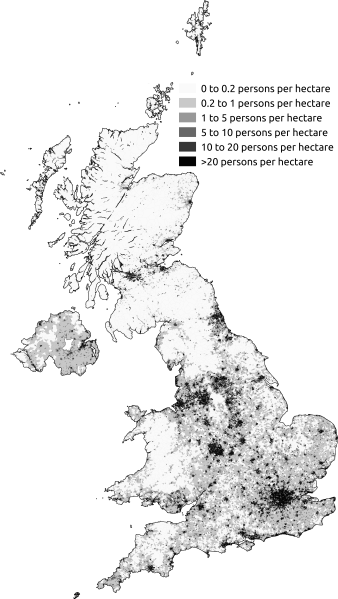
Population density can be described as being densely populated or sparsely populated. Population density can be shown using a density shading map. This population density map shows that some areas are far more densely populated than others. In Wales it can be seen that parts of the South Wales Valleys are densely populated, as is an area in the North East of Wales. This is an example of describing a geographical pattern. Large parts of Mid, West and North Wales are sparsely populated. Urban areas are usually densely populated whereas rural areas are sparsely populated.
Compare the population density map of Wales (use the Welsh part of the U.K. map) with the distribution of parliamentary seats in Wales. Can you see any relationship between population density and the political party elected?
The parts of Wales that have the highest population density also seem to vote for Labour (red).
Compare population density of the U.K. with the 2010 election results. Can you identify any patterns?
Areas with the highest population densities tended to vote for the Labour Party. In England areas with lower population density more M.P.s were elected from the Conservative Party. In Scotland and Wales, areas with lower population density tended to vote for either the Liberal Democrats or a nationalist Party such as Plaid Cymru. In Northern Ireland, areas in the North East with higher population density tended to vote for unionist parties. In areas closer to the border with the Irish Republic there is a lower population density and more seats were won by republican parties.
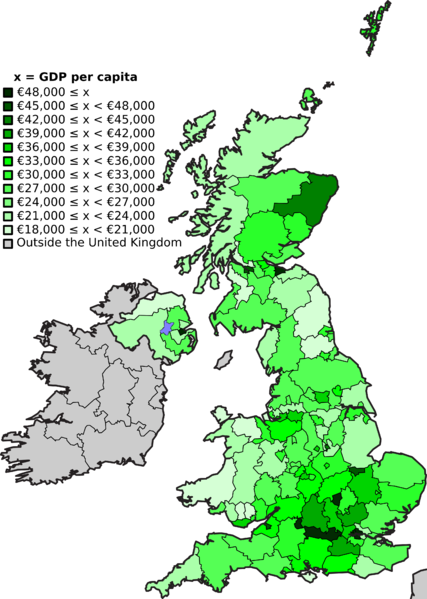
This is a density shading map of Gross Domestic Product per Capita or G.D.P.per Capita. G.D.P. is one measure of how much money is earned each year in a place or country. Per Capita means per head or per person.
Discussion
Can you identify any similar geographical patterns between the G.D.P. map of the U.K. and the map showing the distribution of seats from the 2010 General Election?
Even though all constituency seats are equal, some are more important than others in deciding which party or parties will form the next government. Some seats are described as being ‘safe seats’, this means that one party is so strong in that constituency that it would be almost impossible for its candidate to lose to one of the other parties. Often safe seats are very geographical; many former industrial areas such as the Valleys of South Wales are often strongholds for the Labour Party, many wealthier areas in the South of England are Conservative Party strongholds. Some seats however are described as marginal constituency seats; these are seats where no single party is much stronger than another.
Copyright © 2015 BBC
Out of the 650 seats 194 currently have a majority of 10% of the people who voted. These are the marginal seats that will decide the next government of the U.K. Marginal seats are not evenly distributed: within England, 15% of seats in the South East have majorities of 10% or less, compared with 51% in the South West. In Scotland, 19% of seats fall into this category, compared with 45% in Wales. Wales is going to be a very important battleground especially for the Labour Party that currently holds 11 of these.
|
Party |
Vote Share % |
Seats |
|
Conservative |
36.1 |
47.1 |
|
Labour |
29 |
39.7 |
|
Liberal Democrat |
23 |
8.8 |
|
Others |
11.9 |
4.4 |
We can take this idea of of not all seats being of equal importance further by looking at our democracy and the idea of one person – one vote and asking “Is each vote equal?” Look at this table, does this seem fair to you? This is the kind of pattern that exists with a ‘first past the post’ system. Labour and the Liberal Democrats had a similar % of the vote but Labour had over four times as many seats. A lot of other countries have a system called Proportional Representation in which seats are awarded in line with the share or proportion of the vote; if a party wins 23% of the vote then it gets 23% of the seats. In the National Assembly elections in Wales we have a system in which 40 seats are first past the post in constituencies, and then the remaining 20 seats are based on a form of proportional representation.
Discussion Question
Do you think that a ‘first past the post’ system is a fair way for a democracy to choose a government?
- A first past the post system tends to return either a single party to power or a strong coalition made up of two parties to power.
- This creates a strong stable government.
- In other democracies with proportional representation there can be weak coalition governments made up of many small parties. As disagreements happen coalitions break up and a new government may form of a different coalition of new partners. This less stable form of government may be more democratic but it can lead to problems with weak governments and constantly changing policies which is bad for a country.
The reality is that the next government will be decided by very few voters. In marginal seats there will be the core vote of loyal party supporters and few undecided voters or voters who will change parties. If you live in a marginal seat then you will see a lot of local campaigning by the leaders of the main parties. If you live in a safe seat then you might not see any.
Discussion Question
Do you think that in a national democracy it is fair that very few voters in marginal seats will decide the next government?
Discussion Question
The Liberal Democrats want to change the voting system to a form of proportional representation, but would it be better to make everyone vote by law?
In 2010 the Conservative Party had the largest share of the vote with 36%. 35% of the electorate did not vote; if everyone in the electorate were forced to turnout then there would probably be very few safe seats. One other idea was tried in the referendum on Scottish independence in 2014; in this election 16 and 17 year olds were also given the vote. It is the older people that are much more likely to vote; if more younger people could be encouraged to vote then there could be a big change.
Activity
Try and hold a mock election; how do your election results differ from the 2010 General Election results?