Demographics of Wales

Demography
Demography is the study of population and if something is described as demographic it has something to do with population. Demography is a very important aspect of Geography as our governments have to plan for the future not just today so they need to know now what they will need to do to prepare for the decades to come.

Birth Rate
Population changes naturally as a result in changes between the numbers of people born (birth rate) and the numbers of people dying (death rate). Population also changes as a result of migration (people moving from one place to another). How many people live in an area is called the population density.
If you are unsure of any of these terms carry out the activities on the 'Aspects of Demography' article in this issue.
Below is a spread sheet showing key aspects of population data in Wales for 2010.
| Area | Area km | Density per km | Population |
| Wales | 20780 | 144 | 3006430 |
| Isle of Anglesey | 714 | 96 | 68592 |
| Gwynedd | 2548 | 46 | 119007 |
| Conwy | 1130 | 98 | 110863 |
| Denbighshire | 838 | 115 | 96731 |
| Flintshire | 437 | 341 | 149709 |
| Wrexham | 503 | 265 | 133559 |
| Powys | 5196 | 25 | 131313 |
| Ceredigion | 1789 | 43 | 76938 |
| Pembrokeshire | 1618 | 72 | 117086 |
| Carmarthenshire | 2371 | 76 | 180717 |
| Swansea | 378 | 615 | 232501 |
| Neath Port Talbot | 442 | 311 | 137392 |
| Bridgend | 251 | 537 | 134564 |
| The Vale of Glamorgan | 331 | 377 | 124976 |
| Cardiff | 140 | 2430 | 341054 |
| Rhondda, Cynon, Taf | 424 | 552 | 234309 |
| Merthyr Tydfil | 111 | 502 | 55699 |
| Caerphilly | 277 | 624 | 173124 |
| Blaenau Gwent | 109 | 629 | 68368 |
| Torfaen | 126 | 717 | 90533 |
| Monmouthshire | 851 | 103 | 88089 |
| Newport | 190 | 742 | 141306 |
Imagine that you are in charge of providing services such as health care or refuse collection in the Welsh Government or in a rural area such as Powys and an urban area such as Swansea. If you were in Powys you would have to provide services to a far larger area but there would be far fewer people paying taxes to cover the cost.
So what would you do?
-
Provide the same services to both but make each person in Powys pay more than double for the same service.
-
Provide people in Powys with far worse services because that is what they pay for.
-
Take money from people in urban area such as Swansea and use it to pay for services in rural areas such as Powys.
Nobody wants to pay higher taxes, we complain bitterly if there is a 'postcode lottery' of services such as healthcare and it certainly isn't fair to ask people in urban areas who do not have the benefits of living in rural areas (such as the environment, lower crime rates or lower pollution rates) to subsidise those who do live in these places.
So what would you do?
Below is a spread sheet showing natural increase & migration in Wales for between 2009 & 2010.
| Area | Births | Deaths | Natural Change | Migration | Population Change |
| Wales | 35.258 | 30.618 | 4.64 | 2.471 | 7.111 |
| Isle of Anglesey | 0.778 | 0.858 | -0.08 | -0.096 | -0.176 |
| Gwynedd | 1.355 | 1.35 | 0.005 | 0.235 | 0.24 |
| Conwy | 1.176 | 1.444 | -0.268 | -0.222 | -0.49 |
| Denbighshire | 1.042 | 1.117 | -0.075 | 0.074 | -0.001 |
| Flintshire | 1.82 | 1.403 | 0.417 | -0.631 | -0.214 |
| Wrexham | 1.669 | 1.309 | 0.36 | -0.008 | 0.352 |
| Powys | 1.195 | 1.431 | -0.236 | -0.187 | -0.423 |
| Ceredigion | 0.681 | 0.746 | -0.065 | 0.603 | 0.538 |
| Pembrokeshire | 1.277 | 1.332 | -0.055 | -0.284 | -0.339 |
| Carmarthenshire | 1.888 | 2.05 | -0.162 | 0.112 | -0.05 |
| Swansea | 2.624 | 2.379 | 0.245 | 0.949 | 1.194 |
| Neath Port Talbot | 1.595 | 1.541 | 0.054 | -0.087 | -0.033 |
| Bridgend | 1.596 | 1.328 | 0.268 | 0.099 | 0.367 |
| The Vale of Glamorgan | 1.517 | 1.201 | 0.316 | 0.055 | 0.371 |
| Cardiff | 4.608 | 2.663 | 1.945 | 2.871 | 4.816 |
| Rhondda, Cynon, Taf | 2.888 | 2.368 | 0.52 | -0.614 | -0.094 |
| Merthyr Tydfil | 0.692 | 0.567 | 0.125 | -0.083 | 0.042 |
| Caerphilly | 2.174 | 1.634 | 0.54 | -0.153 | 0.387 |
| Blaenau Gwent | 0.807 | 0.773 | 0.034 | -0.296 | -0.262 |
| Torfaen | 1.08 | 0.905 | 0.175 | -0.362 | -0.187 |
| Monmouthshire | 0.827 | 0.881 | -0.054 | 0.176 | 0.122 |
| Newport | 1.969 | 1.338 | 0.631 | 0.32 | 0.951 |
The births and deaths above are in 1000's rather than the usual way of showing them as rates per 1000 of the population but they give you a better view of how many actual babies are born compared to how many people actually die. You can also see patterns of migration.
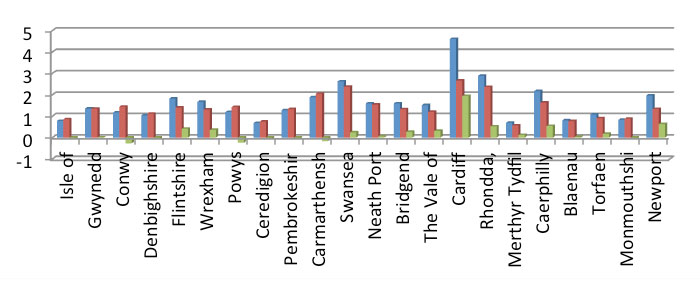
Overall you can see that Wales has an increasing population as a result of natural change. However this pattern is not the same everywhere; rural areas such as Powys are seeing significantly higher numbers of deaths than births they are also seeing significant loss of population through migration. So the population is increasing in urban areas but decreasing rural areas - why do you think this is?
Migration is actually the main reason why this is happening. Overall migration figures show a gain or a loss but they do not show flows in both directions - in and out.
Rural areas tend to attract older people who want to retire to the countryside. They often sell their homes in urban areas and have the ability to buy rural properties, this process is sometimes called counterurbanisation.
This has two effects:
-
Older people will not have babies but are more likely to die so this changes the natural increase figures to an actual natural decrease.
-
They drive up property prices meaning that local young people have little chance of getting a suitable place to live. Often work in rural areas is tied to agriculture or tourism which are often both low paid and seasonal. Young people in the countryside often find it impossible to find a place to live when they start a family and so they are forced to migrate to urban areas.
Migration from rural areas to urban areas is often called urbanisation.
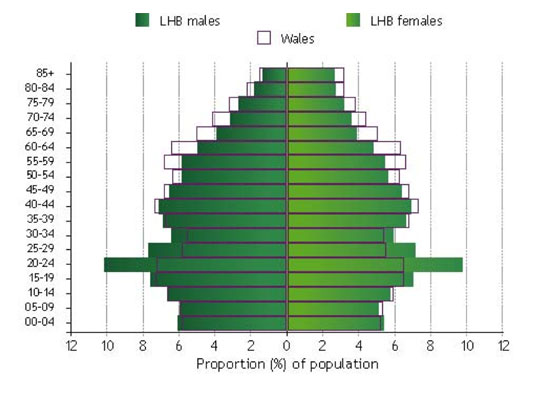
Population of a place is often shown using a special graph called a population pyramid which shows the numbers of males and females in each age range of a population. As you can see below in the Powys LHB area (Local Health Board) there are far more older people and far fewer younger people compared to Wales as a whole. Especially in the age range of 20 - 35 this is significant as this is the age range that accounts for most births. What do you think that this will mean in the future?
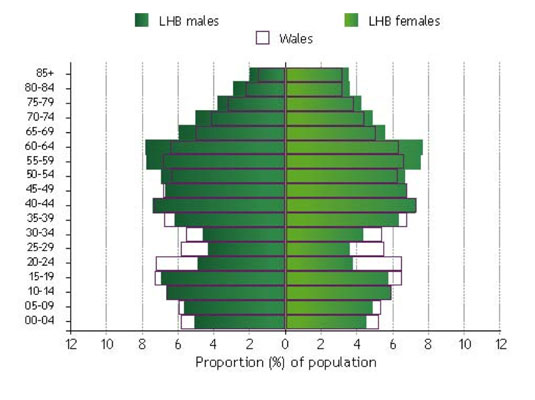
Compare this with a population pyramid for Cardiff & The Vale LHB.
In Cardiff the population structure is almost reversed with less older people than the Welsh average and far more people in the age range 20-35. This means that as proportion of the population there are far more of working age in this urban area so they will be contributing more in taxes but requiring less in services because their healthcare needs are lower than older people. They are also far more likely to have children in the future so the population here is likely to increase.
Activity
Decision Making Exercise
As a Geographer you have been asked to advise the Welsh Government on population issues in Wales and advise on future policy. Working in small groups; devise a PowerPoint presentation and write a script to present your ideas to your class. Use the spread sheets in this article to draw your own graphs to illustrate the issues you identify.
For more information use the data from statswales on the link below.