Investigating Winter Storms
In this linked article we are going to look at the storms of winter 2015-2016 and the record breaking rainfall that they brought.
We are going to take our information from the Met Office Website; images and data are covered by the Open Government License "Contains public sector information licensed under the Open Government Licence v1.0".
For the detailed original information direct from the Met Office follow this link:
Met Office - Click below

The storms of winter 2015 helped new UK rainfall records. December 2015 was the wettest calendar month since 1910, while November and December combined was the wettest combined two-month period.
The first named storm as part of the new pilot project was Storm Abigail which hit North West Scotland on the 12/13th November 2015 was mainly of risk due to its wind impacts with wind up to 84 mph.
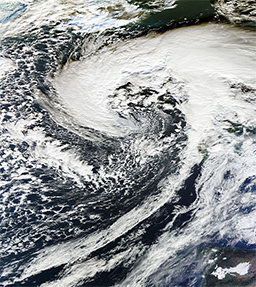
Image: Abigail Nov 12 2015 1155Z - NASA © Wikimedia Commons - Public Domain
Over 20,000 homes had power cut and there were school closures but in terms of the media attention received as the first ever UK named storm it was not a big event mainly as it mostly missed the UK and was worst felt in the Scottish Islands off the West Coast which are well adapted to severe weather, especially wind.
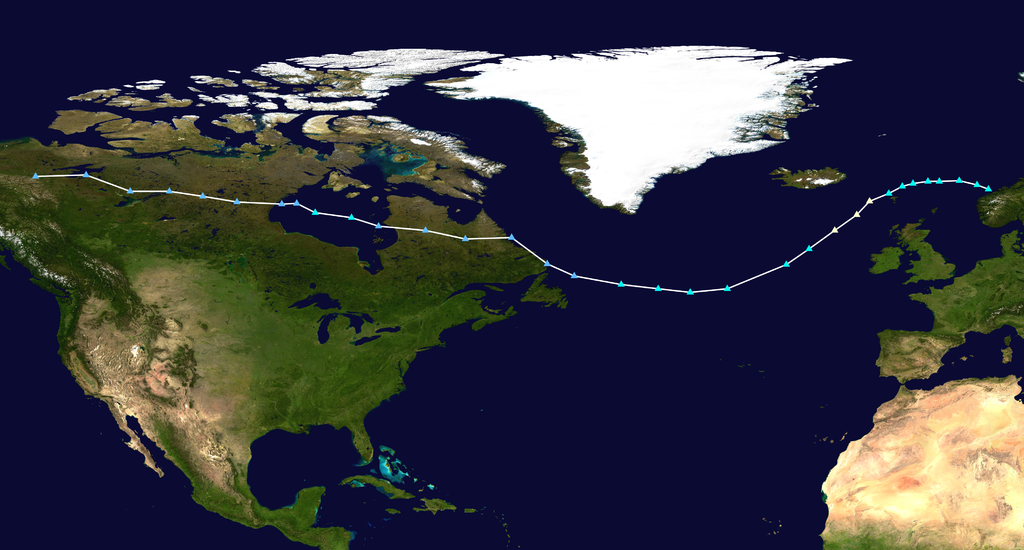
Image: Abigail 2015 track - Supportstorm © Wikimedia Commons - Public Domain
Storm Barney hit parts of West Wales and South Western England on the 17th of November before travelling Eastwards through England. Wind was the main feature with gusts up to 85 mph.
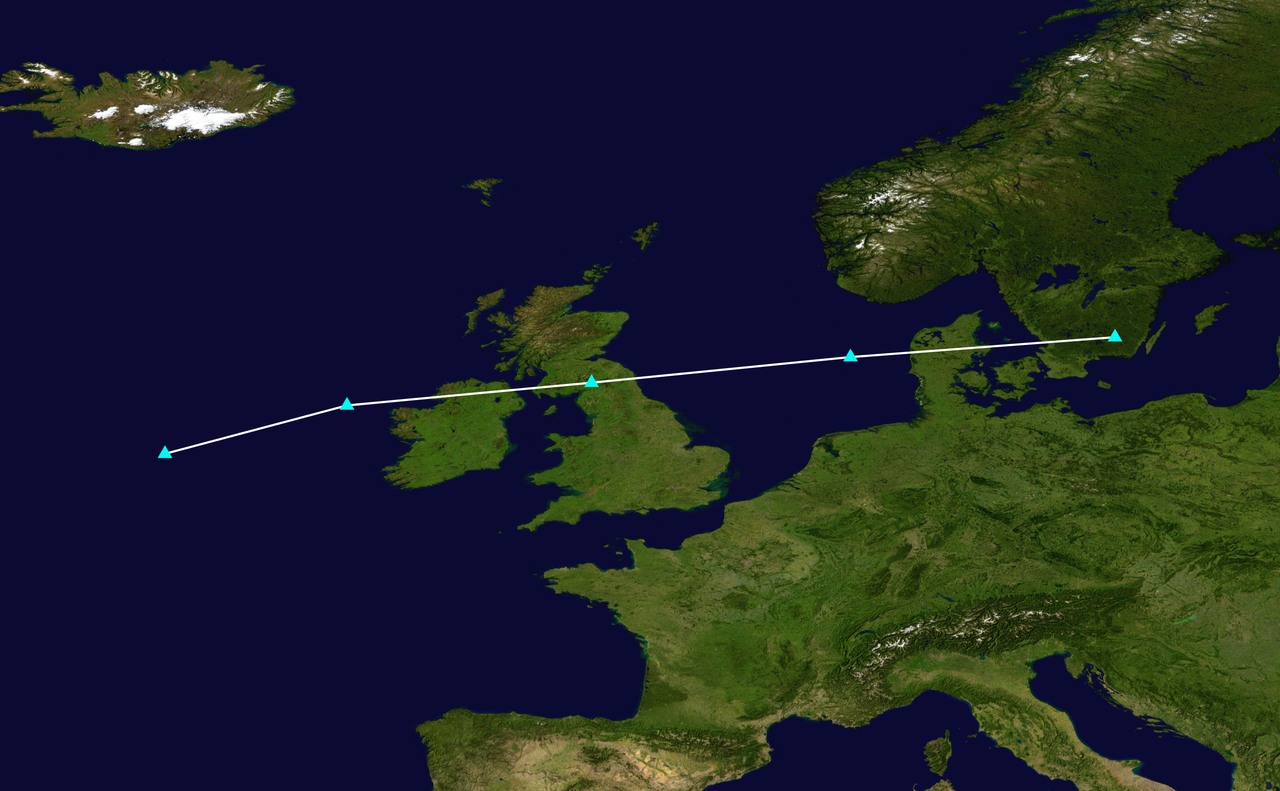
Image: Barney 2015 track - Supportstorm © Wikimedia Commons - Public Domain
Some buildings were damaged, thousands of homes lost power, railways were shut down, large trampolines were photographed wedged in trees 20 metres off the ground (trampolines are very dangerous in high winds and cause a lot of property damage – tie them down!) and there was localised flooding.
Storm Barney was far more destructive however in the ROI where 45,000 homes lost power and widespread destruction took place.
Storm Clodagh was again worse in the ROI Republic of Ireland) though not as bad as storm Barney; wind gusts were lower in the 60’s mph causing 6,000 power outages; the storm then moved westwards causing a further 10,000 power outages in Northern England. As with most parts of the West there is much better adaptation to high winds because they occur much more often. Wind speeds that would cause very little disruption in the Western parts of Scotland and Wales would probably cause large scale destruction in Southern and Eastern England.
The public in much of the UK however were starting to think that named storms were just a bit of a gimmick with nothing serious happening; that was until storms Desmond, Eva & Frank in December.
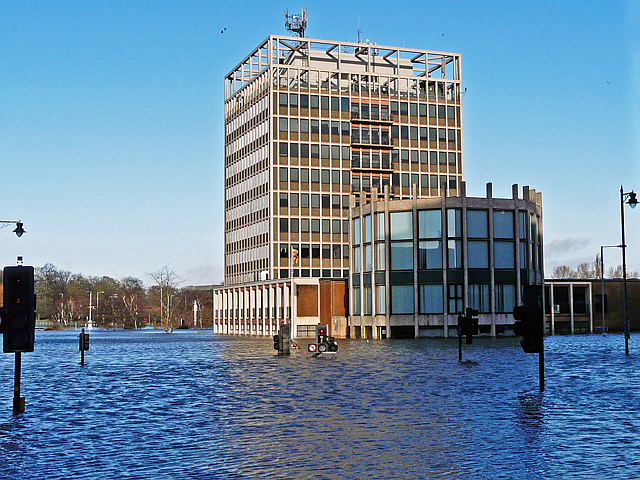
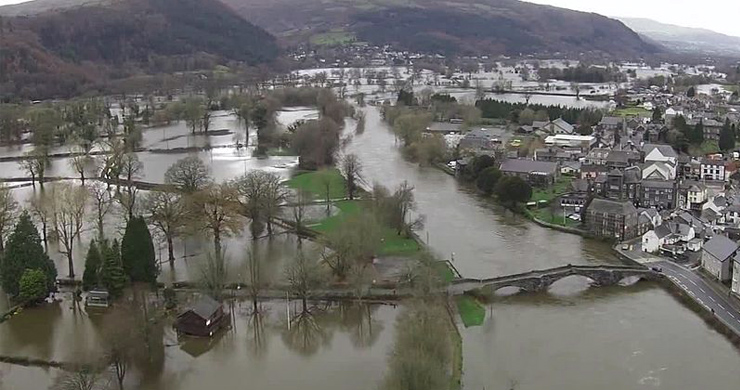
Image: Carlisle Civic Centre amid floodwater (geograph 4761015) - Rose and Trev Clough © Wikimedia Commons under Creative Commons Attribution 2.0 Generic
Storm Desmond was the first of the big December storms; it must be remembered that November had already been very wet which means that most of the stores within drainage basins were full. Sometimes this is termed saturated as the biggest stores such as the soil act like a sponge; when a sponge can hold no more water it is called saturated.
Experiment
Try dripping water onto a dry piece of sponge to find out its capacity or how much water will saturate it or cause it to reach saturation.
As well as strong winds Storm Desmond also brought record breaking rainfall. Convert the data below into a graph to illustrate how much rain fell in some places – both the new 24 hour and 48 hour record rainfall totals.
|
|
mm |
|
Average Height of Man in UK |
1753 |
|
Average Height of UK boy aged six |
1170 |
|
48 Hour rainfall record Thirlmere, Cumbria 5/6th Dec. 2015 |
405 |
|
24 Hour rainfall record Honister Pass, Cumbria 5th Dec. 2015 |
341.4 |
Cumbria was the worst affected but most of the North of England suffered some of the highest impacts on record:
- Very Rare ‘Red’ Met Office warning issued for Cumbria.
- Rivers Eden, Lune and Tyne have their highest recorded flow rates or discharge.
- 3 deaths attributed to the flood.
- Estimate of approximately £500 million cost.
- 55,500 households in Lancaster and 13,000 in lost power when an electricity substation flooded.
- An estimated 7,000 homes were flooded.
- Roads, bridges and buildings were washed away by flooded rivers.
Storm Eva
Storm Eva has been wrongly accused of widespread flooding across Christmas 2015.
Storm Eva mainly caused problems due to wind in the ROI and afterwards its worst impacts were similar to Storm Abigail across the Western Isles of Scotland.
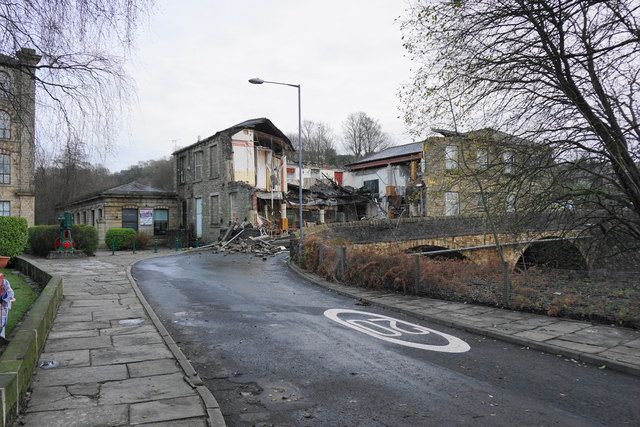
Image: The Waterside, Summerseat - Bill Boaden © Wikimedia Commons under Creative Commons Attribution-Share Alike 2.0 UK: England & Wales
When the serious flooding of Christmas 2015 occurred Storm Eva was already far to the North of the UK. The flooding itself was caused by a different storm that had not been named because it did not have high enough winds.
The storm that followed Eva again hit Cumbria and the North of England. There was new serious flooding in the major city of York and a further 9,000 homes were flooded bringing the December total to 17,000. One death has been attributed to this storm and estimates of damage as high as £800 million have been put forward.

© UK rain radar 1200 GMT 23 to 1400 GMT 24 December 2015 - Met Office under Crown Copyright
Storm Frank
Frank was the last named storm of 2015 hitting the UK on the 28th of December; Storm Frank caused its worst damage of North eastern Scotland where heavy rain persisted for many days. Elsewhere in the UK impacts were reported from Cornwall to the far North of Scotland.
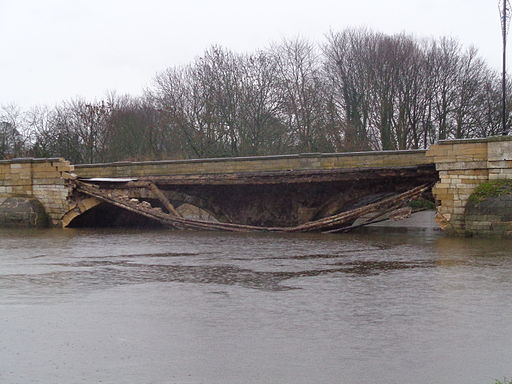
Image: Partially collapsed Tadcaster Bridge (30th December 2015) 002 - Mtaylor848 © Wikimedia Commons under Creative Commons Attribution-Share Alike 4.0 International
The heaviest wind was recorded at 85mph in the Outer Hebrides; three fatalities were attributed to the storm and power outages were reported in 27,900 properties. Widespread disruption also included the collapse of the Tadcaster Bridge.
© UK rain radar 0300 GMT 25 to 0600 GMT 27 December 2015 - Met Office under Crown Copyright
Storm Gertrude
Luckily Storm Gertrude largely missed Wales instead mainly affecting Northern Ireland and North Western Scotland where the strongest wind speeds for sixteen years were recorded at 105mph!
However despite another near miss for Wales there was still localised flooding and disruption due to wind damage such as the M4 being closed after overhead signs were blown down.
Storm Henry
Hard on the heels of Storm Gertrude came storm Henry; thankfully another near miss for Wales following the same track as Gertrude to the North West. Henry though had more effects inland in Scotland than Gertrude and brought more widespread rainfall.
Pupil Activity
Try to use you literacy and numeracy skills to write a description of both of these maps and both graphs.
For each try to answer each question as part of your description.
Map 1
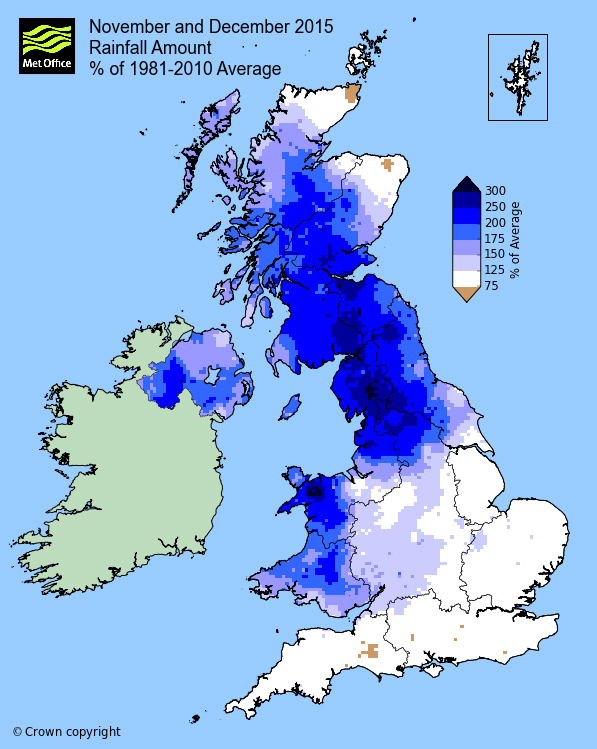
UK rainfall totals for November and December 2015 as percentage of long-term average
- Overall what is it showing?
- Which places have the highest values (numbers)?
- Are any of the places with the highest values in Wales? Where?
Graph 1
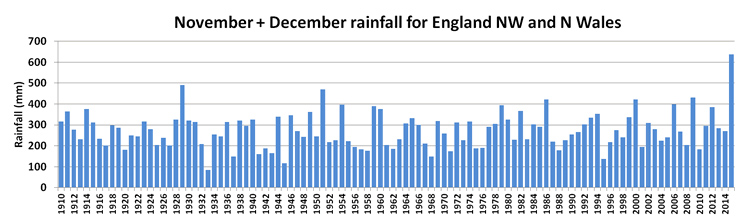
UK rainfall totals for November and December 2015 as percentage of long-term average
- Overall what is it showing?
- Which years have the highest values (numbers)?
- Which years have the lowest values (numbers)?
- Estimate (or work it out fully) a mean or average value.
- Roughly estimate how much bigger 2015 is compared to your estimate; choose from:
- Times 1
- Times 1.5
- Times 2
- Times 2.5
- Times 3
- Times 3.5
- Times 4
Map 2
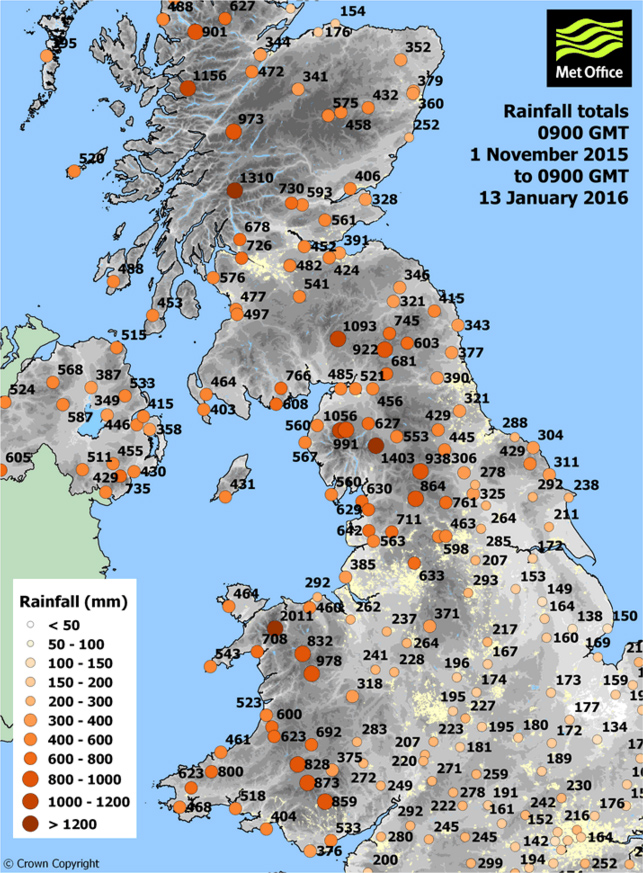
Rainfall totals 1 November 2015 to 13 January 2016
- Overall what is it showing?
- Which 3 places have the highest values (numbers)?
- Where are they?
- Are any of the places with the highest values in Wales?
- Where?
Graph 2
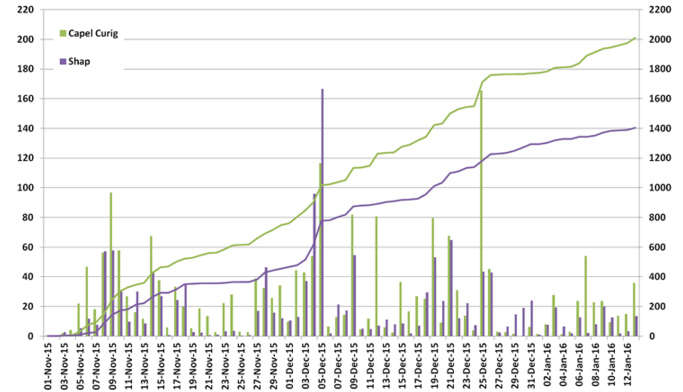
Daily rainfall totals and accumulations for Capel Curig and Shap
- Overall what is the graph showing?
- Where is Shap?
- Where is Capel Curig?
- Compare the rainfall for both locations in November and December.
Related Articles...