How green is your valley?
How can I find out if I am having a positive or negative impact on the planet?
If you want to check your impact on the planet, you can measure your carbon footprint. In fact, this has now become the ‘thing’ to do. Many cities, town councils and even some schools are doing it! The Westminster Government monitors the carbon footprint of households to check if we are meeting targets for reducing carbon emissions.
Why not measure your carbon footprint?
You can calculate your carbon footprint when travelling to and from school. To do this using the tool below you'll need to:
-
1. Estimate how far it is from your home to your school.
-
2. Add up the total number of miles. Remember that when you have been dropped off, the driver still has to go back home.
-
3. Know how many passengers are in the car.
What is a ‘carbon footprint’?
This is used to find out how much damage people are doing to the planet. It means how much carbon dioxide people produce as a result of their activities. It is usually measured yearly (annually) and is the amount of carbon dioxide that is produced. As you know, too much carbon dioxide is harmful to the environment.
How is a carbon footprint measured?
A carbon footprint can be measured in global hectares (gha) of ‘earthshare’.
What does this mean?
To be able to do this, the world’s surface was measured to find the area of bio-productive land and sea. This is where we get food and energy from. The world’s population need to use this productive area to be able to live.
What if the bio-productive area was shared out equally?
If it is equally shared out, each of us would get an ‘earthshare’ of just 1.89 gha per person. This is basically how many natural resources there are to go around. This includes things like land, water and food and fuels.
How about the capital of Wales?
Cardiff residents need 5.59 gha to keep up their present way of life - Cardiff uses up 125 times its land area for the resources it consumes so obviously that means some areas of the world have less to use as a result.
Are there other ways of measuring the carbon footprint we use?
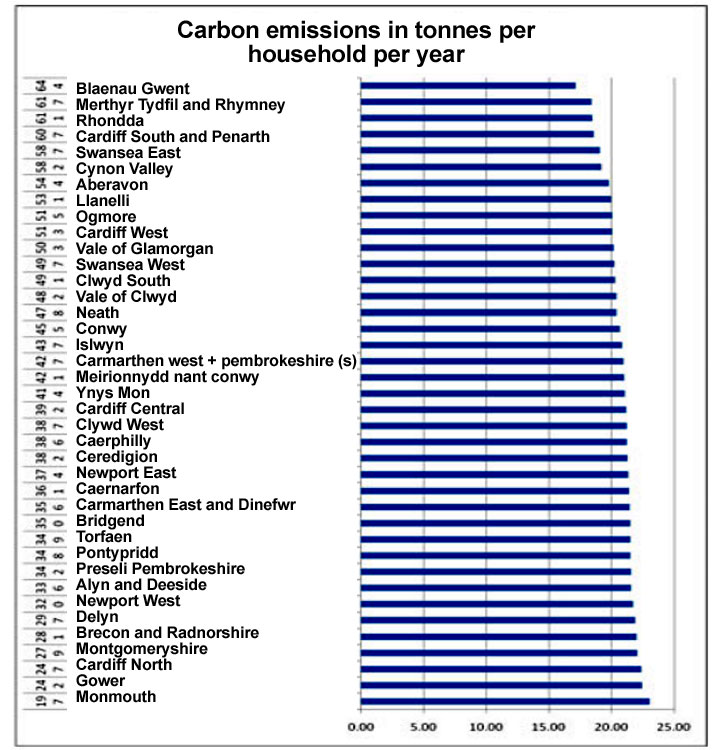
Yes, the Westminster Government measures the average family’s carbon emissions in metric tonnes per year. In 2007, in the rich areas around London, like Chesham and Amersham, the household figure was close to 30 tonnes per year, compared with Wales where some household emissions were less than 20 tonnes per year. The figures show that 196 English areas have greater emissions than anywhere in Wales.
Also, check the chart below to find out how much carbon dioxide each household in your area produces.

Where are the biggest emissions in Wales?
Monmouth produces the greatest amount of carbon dioxide emissions in Wales with 23.01 tonnes.
Where are the smallest emissions in Wales?
The least polluting households are in the valleys of Blaenau Gwent with 17.1 tonnes! But compare this with China where annual emissions per household are 6 tonnes, and 1.5 tonnes in India! It doesn’t look so good now does it?
Tasks:
1. Why not make a list of the possible reasons why the different areas have different CO2 production.
2. Suggest how we could make changes in lifestyle, housing and transport to reduce carbon emissions.
3. Write a letter or design a poster for your local area to publicise your carbon emission levels compared with other regions of Wales and the world.


