Welsh ethnicity
A recent headline: Wales is the least ethnically diverse part of Mainland Britain!
According to the 2001 census, Wales has less people from ethnic minorities than in any other part of the UK. Only four per cent of the population came from ethnic minorities compared with thirteen per cent in England.
Did you know?
What is a census?
A census is a survey of people. In the UK it happens every 10 years.
In the 2001 census there were news stories of objections to not being able to declare oneself Welsh (which is why there is the White British category and not Welsh).
Also, in Wales there are big differences in the numbers of people from ethnic groups. For example, Cardiff, Newport and Swansea are the most diverse, but it is rare to see a non-white person in the Valleys and in North Wales.
Did you know?

Definitions of ethnicity
Ethnicity refers to the division of a population into different ethnic groups. An ethnic group is a group of people who share common race or cultural heritage.
In Wrexham, ninty-nine per cent of the population is white and there are only 131 black people out of a total population of 128,000. Look at the table to see the differences in the population between Newport and Wrexham.
|
Case Studies (2001 census) |
|
Newport |
Wrexham |
|
Total Population |
137,011 |
Total Population |
128,476 |
|
White British |
127,563 |
White British |
125,129 |
|
Irish |
1,045 |
Irish |
626 |
|
Other White |
1,800 |
Other White |
1,318 |
|
Mixed |
1,635 |
Mixed |
452 |
|
Asian |
3,577 |
Asian |
457 |
|
Chinese |
296 |
Chinese |
168 |
|
Black |
734 |
Black |
131 |
|
Other |
361 |
Other |
195 |
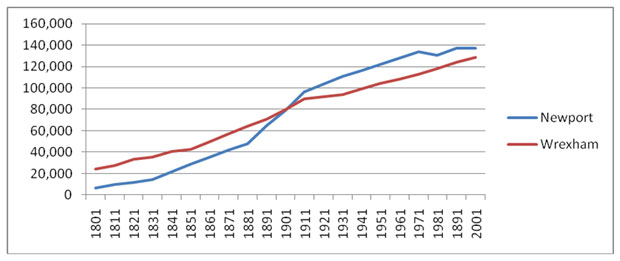
The line graph shows the population data for Wrexham and Newport. It is clear that Newport experienced more inward migration and larger migrations shown by the very rapid overall increase – especially between 1881 and 1911.
|
Year |
Newport |
Wrexham |
Wales |
|
1801 |
6,657 |
24,175 |
533,235 |
|
1811 |
9,644 |
27,180 |
600,612 |
|
1821 |
11, 892 |
33,043 |
708,105 |
|
1831 |
14,634 |
35,458 |
805,749 |
|
1841 |
21,727 |
40,384 |
921,792 |
|
1851 |
29,238 |
42,218 |
1,027,023 |
|
1861 |
35,515 |
49,519 |
1,208,304 |
|
1871 |
41,792 |
56,821 |
1,389,588 |
|
1881 |
48,069 |
64,122 |
1,570,873 |
|
1891 |
65,173 |
70,703 |
1,770,633 |
|
1901 |
79,342 |
79,630 |
2,053,111 |
|
1911 |
96,600 |
89,684 |
2,442,041 |
|
1921 |
103,472 |
91,743 |
2,656,474 |
|
1931 |
110,849 |
93,851 |
2,253,332 |
|
1941 |
116,434 |
98,766 |
2,592,360 |
|
1951 |
122,303 |
103,961 |
2,598,675 |
|
1961 |
128,024 |
108,121 |
2,644,023 |
|
1971 |
134,014 |
112,454 |
2,729,391 |
|
1981 |
131,016 |
118,053 |
2,749,733 |
|
1991 |
137,264 |
124,127 |
2,890,605 |
|
2001 |
137,011 |
128,476 |
2,903,085
|
What does White British mean?
One very important question you might also want to ask is who makes up the 'White British' category? Another question is: who are the Welsh?
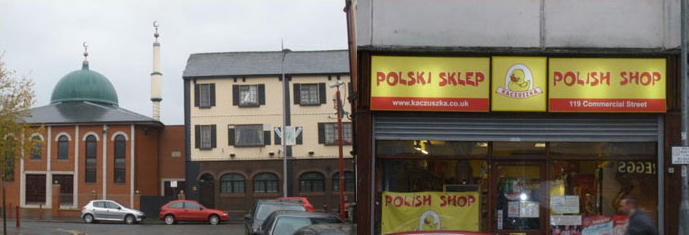
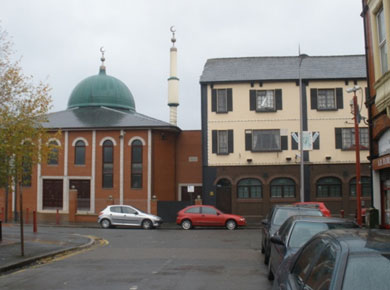
Newport's new mosque next door to Newport's Irish Club. Close to these buildings is a new shop for people from Eastern European countries such as Poland.
There is a big difference in the history of 'The White British' in North/West/Central Wales compared to The South Wales coastal towns and the valleys of South Wales. This is probably illustrated most clearly by the distribution of people who can speak Welsh.
Areas where English is the main language often have a long history of mass inward migration. This photograph shows Newport’s new mosque next door to Newport’s Irish Club. These buildings show the waves of migration into this area. Close to these buildings is a new shop for people from Eastern European countries such as Poland.
People from Eastern Europe are just the latest wave of people moving to this area. Here's another question: in 40 years from now will their grand children be classed as white other (as they are now) or white British?
One way of seeing migration to an area is to look at jumps in the total population. Big jumps don’t come from Natural Increase, but from inward migration. By plotting data as line graphs you should be able to see periods when rapid immigration was taking place.
Did you know?
Population is the total number of people living in an area. Natural increase means the difference between birth and death rate. Birth Rate is the number of living babies being born (it is measured in birth per thousand (0/00) of the population). Death Rate is the number of people dying (it is measured in deaths per thousand (0/00) of the population).
Up until the 1950s, nearly all of these migrants would have come from other parts of the UK, Ireland or Europe. The migrants would now be recorded as white British. In fact, in the past immigration to South Wales and its coastal towns means that most 'White British/Welsh' people have an immigrant background. You can see this clearly in the Rhondda.
|
Population of Rhondda Borough |
|
1801 |
542 |
|
1841 |
748 |
|
1851 |
951 |
|
1861 |
3035 |
|
1861 |
3035 |
|
1871 |
16914 |
|
1881 |
55632 |
|
1891 |
88351 |
|
1901 |
152781 |
|
1921 |
162729 |
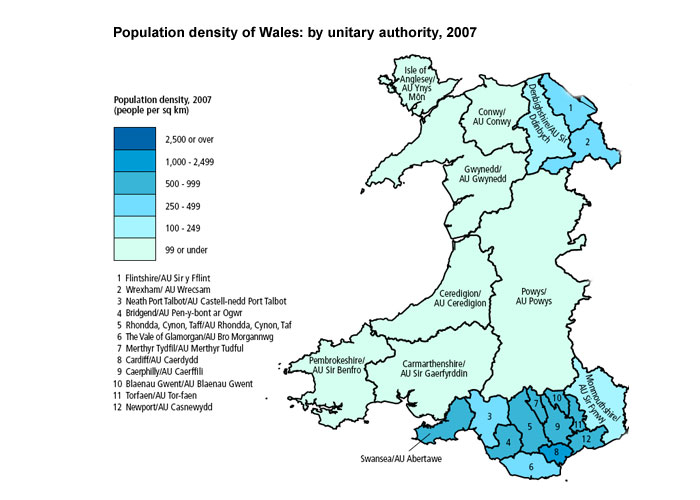
When you look at a map of Wales showing where people live, it is clear to see that most people live where migration has been highest in the past. So, in fact Wales is a very ethnically diverse nation.
Project
Carry out your own census into the ethnicity of your class. Find out where your ancestors came from. Try to go back as far as you can. Compare your communities with others in Wales. Maybe use the data in this article to draw graphs.
Now answer this question: is Wales ethnically diverse?