Investigating Climate Change in Wales and the UK
Investigating Climate Change in Wales and the UK
In this final part of the current edition we are going to research some aspects of climate change in Wales using resources from the Meteorological Office. The Met Office (abbreviated) is our national government funded organisation for weather and climate research just as NOAA is a similar organisation in the USA.
In this article we are going to give you some guidance to carry out research into your local and national climates.

Contains public sector information licensed under the Open Government Licence v3.0
Met Office Weather Station Map

Access information for your local weather station using the interactive weather station map from the Met Office.
Using the interactive map tools you can compare many aspects of the climate and how the 30 year averages have changed since the 1961 – 1990 period.
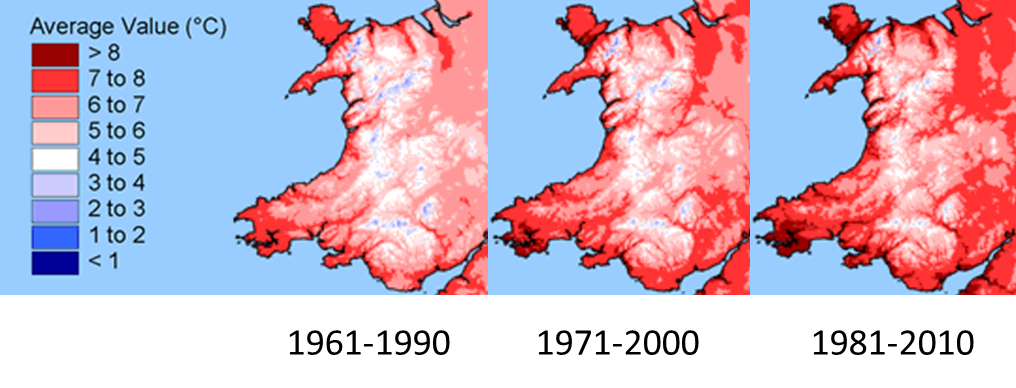
The maps below have been put together showing warming during winter in Wales.
Mean Daily Maximum Temperatures January
Contains public sector information licensed under the Open Government Licence v3.0
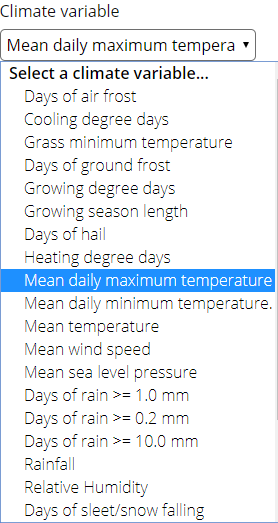
Choose a range of variables to investigate from the drop down menus.
Contains public sector information licensed under the Open Government Licence v3.0
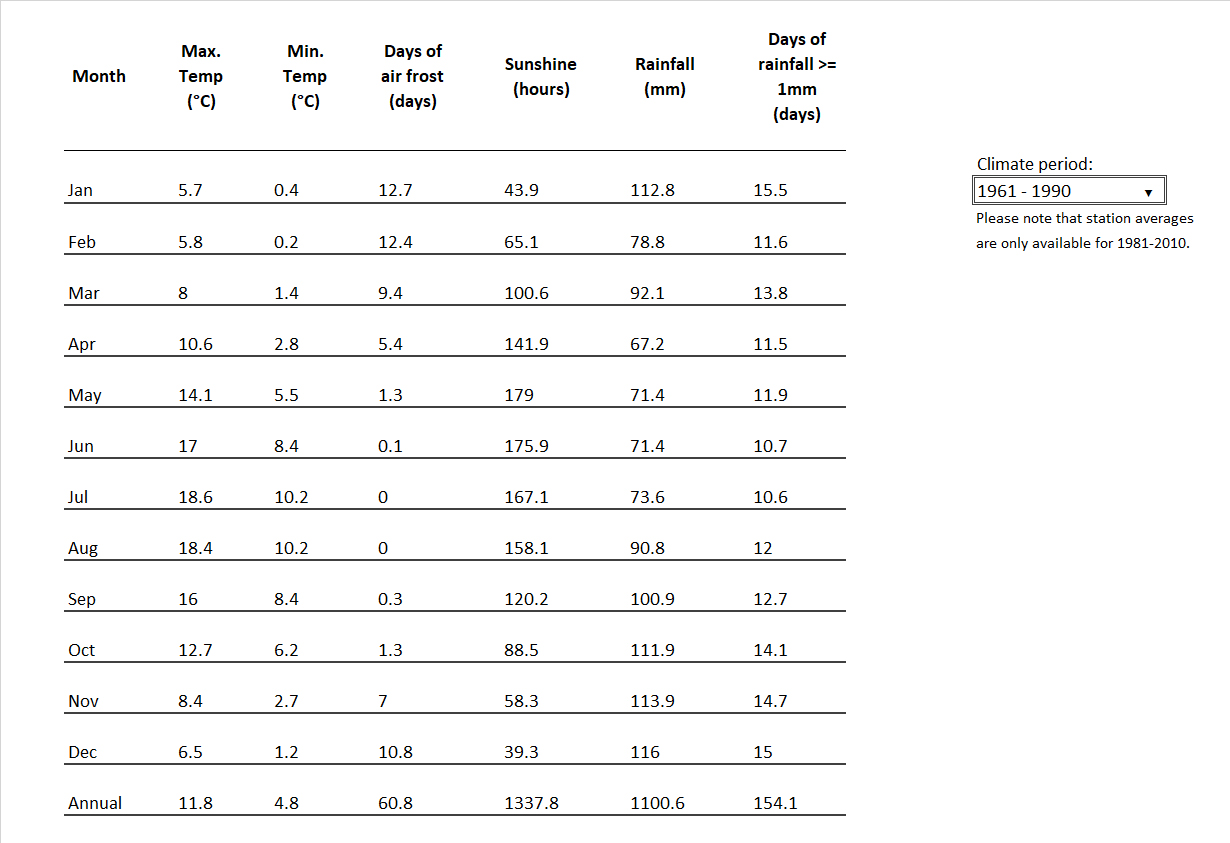
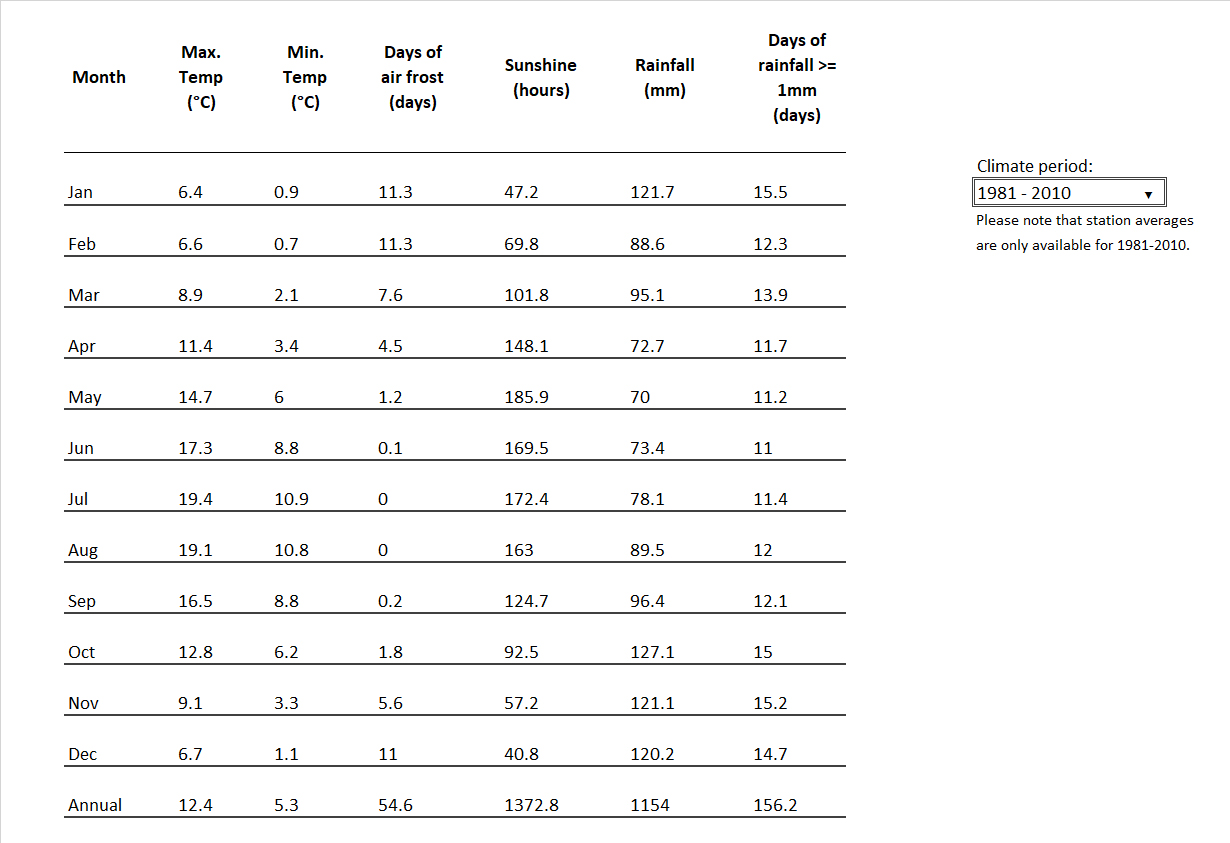
As well as maps it is possible to access data as tables.
Contains public sector information licensed under the Open Government Licence v3.0
| Max Temperature ˚C | ||||||||||||
| Year | JAN | FEB | MAR | APR | MAY | JUN | JUL | AUG | SEP | OCT | NOV | DEC |
| 1961-1990 | 5.7 | 5.8 | 8 | 10.6 | 14.1 | 17 | 18.6 | 18.4 | 16 | 12.7 | 8.4 | 6.5 |
| 1981-2010 | 6.4 | 6.6 | 8.9 | 11.4 | 14.7 | 17.3 | 19.4 | 19.1 | 16.5 | 12.8 | 9.1 | 6.7 |
Notice how many of the months have changes of nearly 1˚C.
You can access historical data for Wales (or other parts of the UK) for example a graph showing mean temperatures for any season or year between 1910 and 2015.
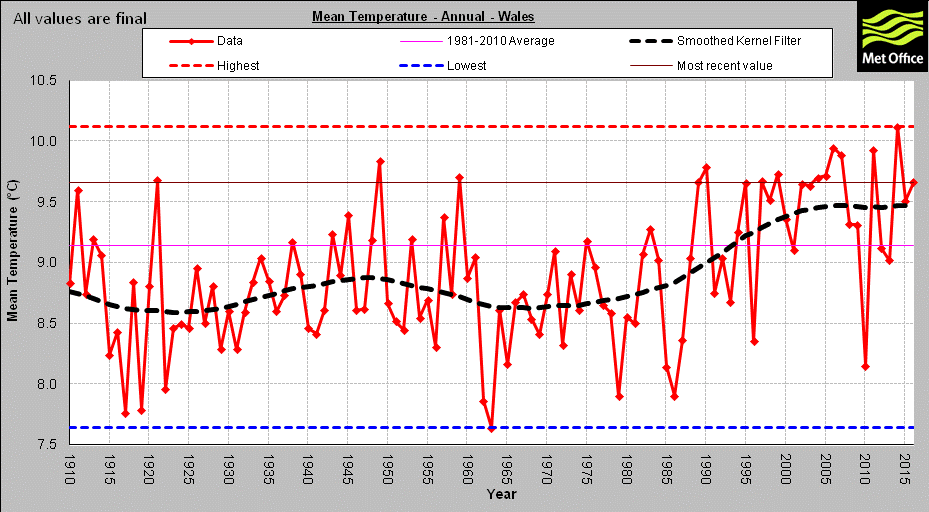
Contains public sector information licensed under the Open Government Licence v3.0
Historical Data Button

Contains public sector information licensed under the Open Government Licence v3.0
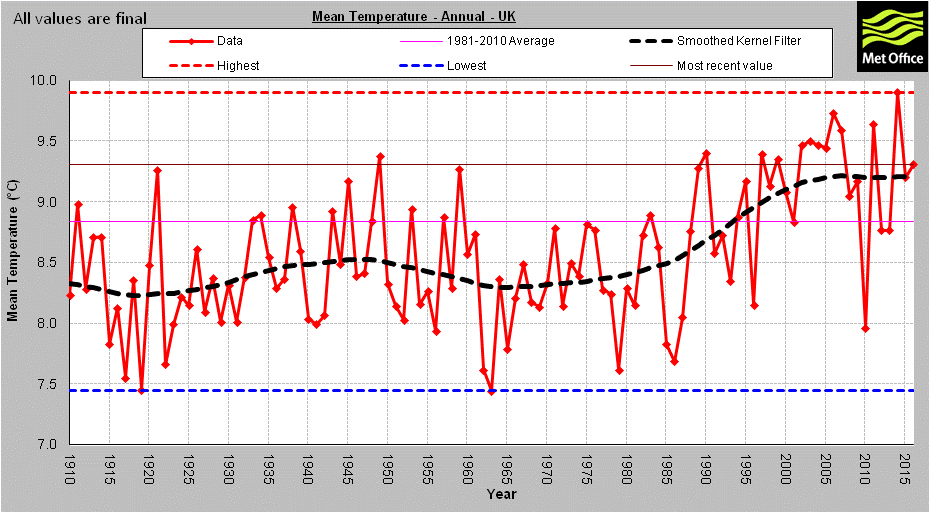
100 years ago UK annual temperature means were mostly around 8-8.3˚C recent years they are more like 9.3-9.5˚C.
Detailed information on climate for Wales or other parts of the UK are also available.
Detailed Historical Climate Button
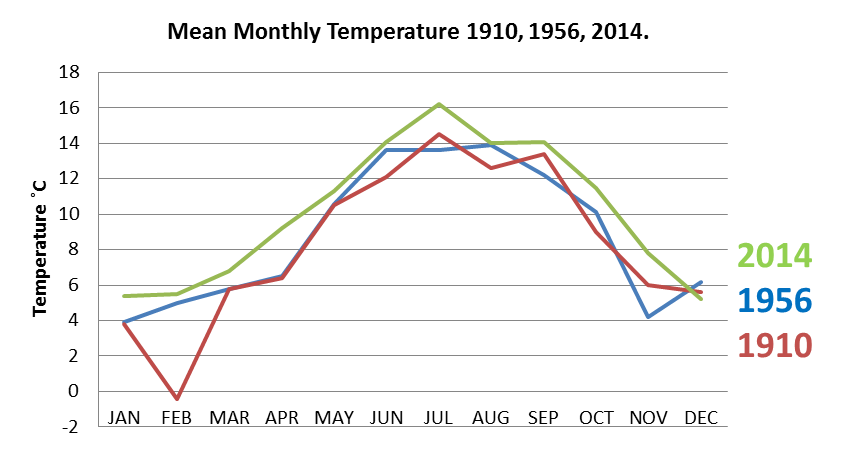
An Extract of three years of monthly data from the start, middle and end of the data on monthly temperature means.
| Year | JAN | FEB | MAR | APR | MAY | JUN | JUL | AUG | SEP | OCT | NOV | DEC |
| 1910 | 3.9 | 5.0 | 5.8 | 6.5 | 10.6 | 13.6 | 13.6 | 13.9 | 12.2 | 10.1 | 4.2 | 6.2 |
| 1956 | 3.8 | -0.4 | 5.8 | 6.4 | 10.5 | 12.1 | 14.5 | 12.6 | 13.4 | 9.0 | 6.0 | 5.6 |
| 2014 | 5.4 | 5.5 | 6.8 | 9.2 | 11.3 | 14.1 | 16.2 | 14.0 | 14.1 | 11.5 | 7.8 | 5.2 |
Student Activity
Complete the investigation part 1 Activity Sheet.